29
/
en
AIzaSyAYiBZKx7MnpbEhh9jyipgxe19OcubqV5w
April 1, 2024
105917
China
CHN
true
2
1
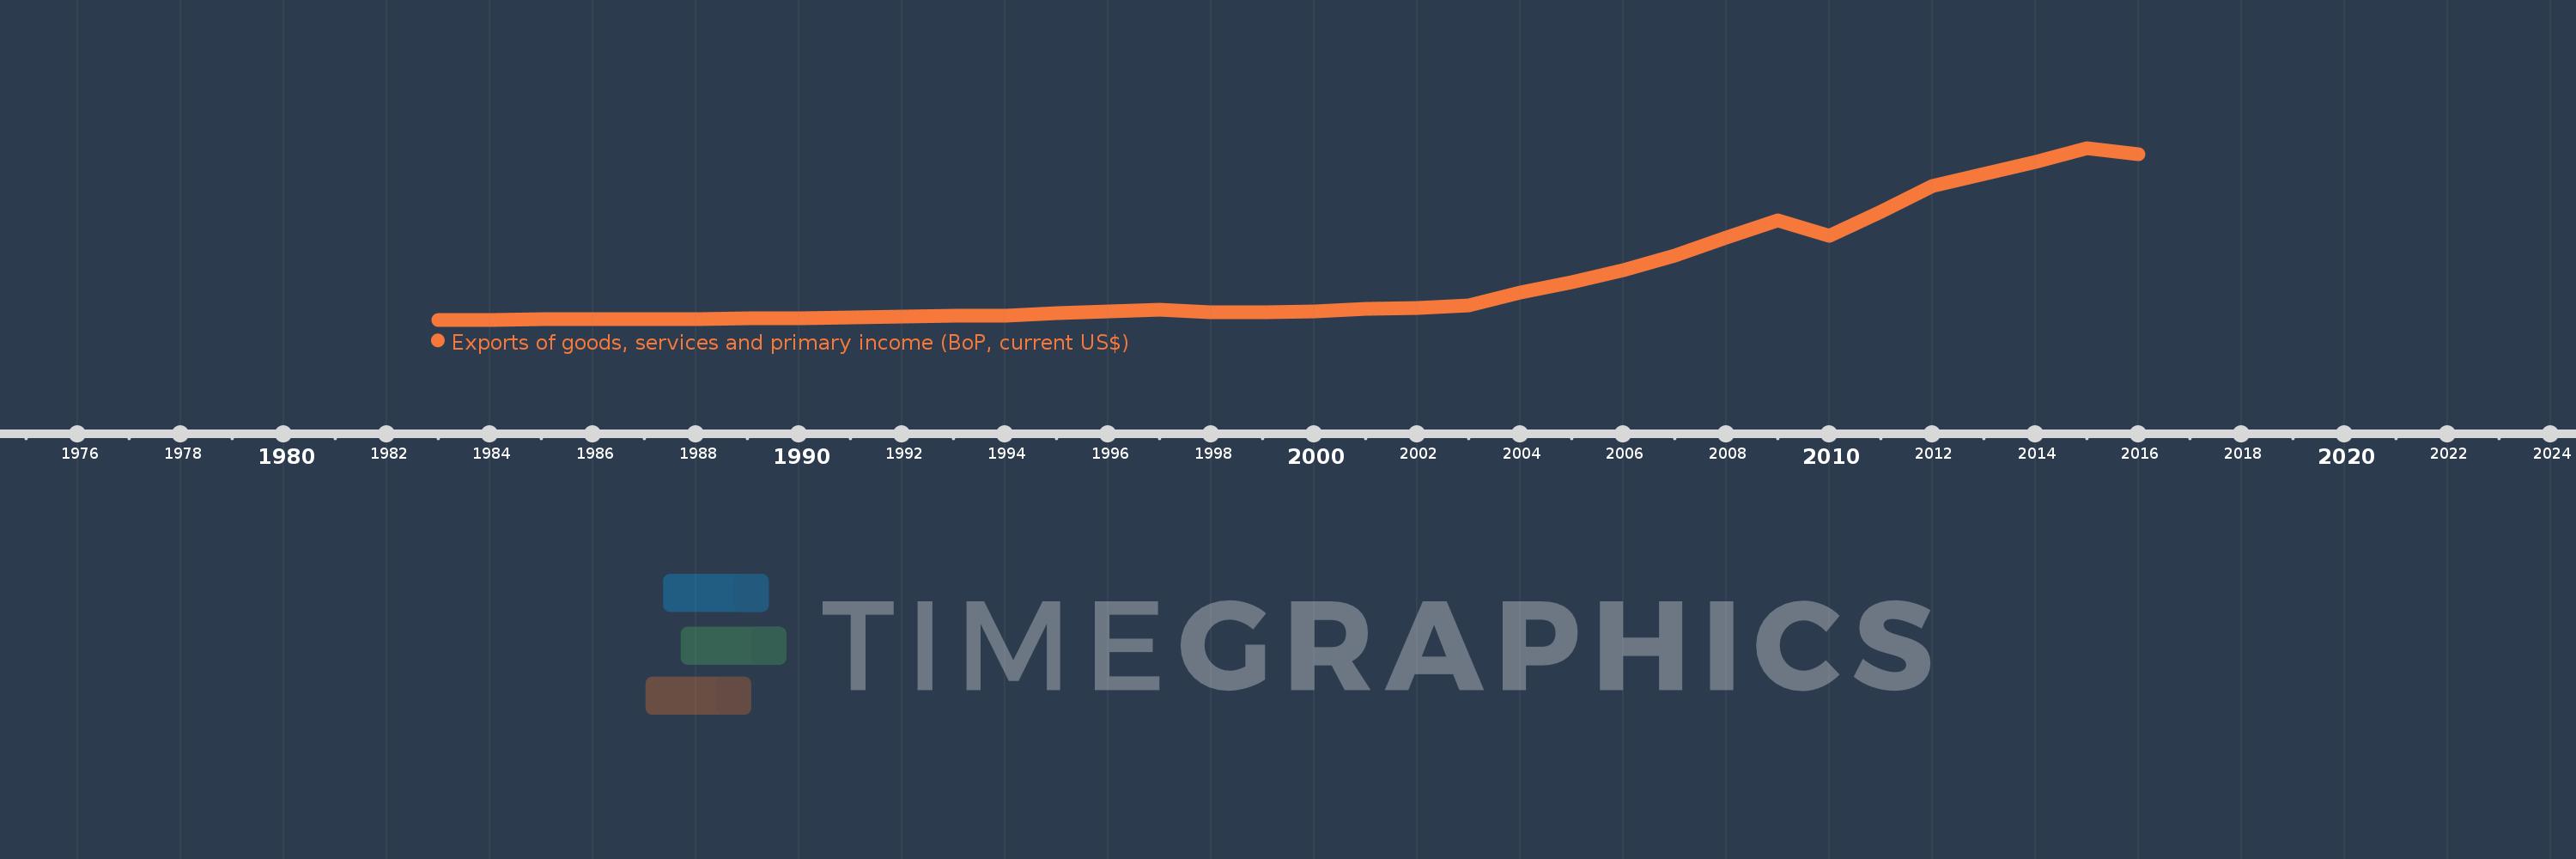
Exports of goods, services and primary income (BoP, current US$)
2016,2015,2014,2013,2012,2011,2010,2009,2008,2007,2006,2005,2004,2003,2002,2001,2000,1999,1998,1997,1996,1995,1994,1993,1992,1991,1990,1989,1988,1987,1986,1985,1984,1983
This statistics in other country:
AfghanistanAlbaniaAlgeriaAngolaAntigua and BarbudaArab WorldArgentinaArmeniaArubaAustraliaAustriaAzerbaijanBahamas, TheBahrainBangladeshBarbadosBelarusBelgiumBelizeBeninBermudaBhutanBoliviaBosnia and HerzegovinaBotswanaBrazilBrunei DarussalamBulgariaBurkina FasoBurundiCabo VerdeCambodiaCameroonCanadaCaribbean small statesCentral African RepublicCentral Europe and the BalticsChadChileChinaColombiaComorosCongo, Dem. Rep.Congo, Rep.Costa RicaCote d'IvoireCroatiaCuracaoCyprusCzech RepublicDenmarkDjiboutiDominicaDominican RepublicEarly-demographic dividendEast Asia & PacificEast Asia & Pacific (excluding high income)East Asia & Pacific (IDA & IBRD countries)EcuadorEgypt, Arab Rep.El SalvadorEquatorial GuineaEritreaEstoniaEthiopiaEuro areaEurope & Central AsiaEurope & Central Asia (excluding high income)Europe & Central Asia (IDA & IBRD countries)European UnionFaroe IslandsFijiFinlandFragile and conflict affected situationsFranceFrench PolynesiaGabonGambia, TheGeorgiaGermanyGhanaGreeceGrenadaGuatemalaGuineaGuinea-BissauGuyanaHaitiHeavily indebted poor countries (HIPC)High incomeHondurasHong Kong SAR, ChinaHungaryIBRD onlyIcelandIDA & IBRD totalIDA blendIDA onlyIDA totalIndiaIndonesiaIran, Islamic Rep.IraqIrelandIsraelItalyJamaicaJapanJordanKazakhstanKenyaKiribatiKorea, Rep.KosovoKuwaitKyrgyz RepublicLao PDRLate-demographic dividendLatin America & Caribbean Latin America & Caribbean (excluding high income)Latin America & the Caribbean (IDA & IBRD countries)LatviaLeast developed countries: UN classificationLebanonLesothoLiberiaLibyaLithuaniaLow & middle incomeLow incomeLower middle incomeLuxembourgMacao SAR, ChinaMacedonia, FYRMadagascarMalawiMalaysiaMaldivesMaliMaltaMarshall IslandsMauritaniaMauritiusMexicoMicronesia, Fed. Sts.Middle East & North Africa (excluding high income)Middle East & North Africa (IDA & IBRD countries)Middle incomeMoldovaMongoliaMontenegroMoroccoMozambiqueMyanmarNamibiaNepalNetherlandsNew CaledoniaNicaraguaNigerNigeriaNorth AmericaNorwayOECD membersOmanPacific island small statesPakistanPalauPanamaPapua New GuineaParaguayPeruPhilippinesPolandPortugalPost-demographic dividendPre-demographic dividendQatarRomaniaRussian FederationRwandaSamoaSao Tome and PrincipeSaudi ArabiaSenegalSerbiaSeychellesSierra LeoneSingaporeSint Maarten (Dutch part)Slovak RepublicSloveniaSolomon IslandsSouth AfricaSouth AsiaSouth Asia (IDA & IBRD)South SudanSpainSri LankaSt. Kitts and NevisSt. LuciaSt. Vincent and the GrenadinesSub-Saharan Africa Sub-Saharan Africa (excluding high income)Sub-Saharan Africa (IDA & IBRD countries)SudanSurinameSwazilandSwedenSwitzerlandSyrian Arab RepublicTajikistanTanzaniaThailandTimor-LesteTogoTongaTrinidad and TobagoTunisiaTurkeyTuvaluUgandaUkraineUnited KingdomUnited StatesUpper middle incomeUruguayVanuatuVenezuela, RBVietnamWest Bank and GazaWorldYemen, Rep.ZambiaZimbabwe Timeline:
This timeline shows a graph from 1983 to 2016 of China. No data until 1982. Number of actual observations by date: 34.
Source name:
World Development Indicators
Source organization:
International Monetary Fund, Balance of Payments Statistics Yearbook and data files.
Categories, topics:
Economy & Growth, External Debt, Trade
Last updated:
apr 23, 2017
Indicators value changes by year
Minimum:
24.729 bln
jan 1, 1983
Maximum:
2.764 trl
jan 1, 2015
At the date of observation
Value
Absolute change
Change from previous value
jan 1, 1983
24.729 bln
+24.729 bln
0.0%
jan 1, 1984
24.735 bln
+6.0 mln
0.02%
jan 1, 1985
28.724 bln
+3.989 bln
16.13%
jan 1, 1986
29.641 bln
+917.0 mln
3.19%
jan 1, 1987
30.683 bln
+1.042 bln
3.52%
jan 1, 1988
40.147 bln
+9.464 bln
30.84%
jan 1, 1989
47.381 bln
+7.234 bln
18.02%
jan 1, 1990
49.717 bln
+2.336 bln
4.93%
jan 1, 1991
60.391 bln
+10.674 bln
21.47%
jan 1, 1992
69.617 bln
+9.226 bln
15.28%
jan 1, 1993
84.412 bln
+14.795 bln
21.25%
jan 1, 1994
91.242 bln
+6.83 bln
8.09%
jan 1, 1995
124.918 bln
+33.676 bln
36.91%
jan 1, 1996
152.431 bln
+27.513 bln
22.03%
jan 1, 1997
178.996 bln
+26.565 bln
17.43%
jan 1, 1998
146.243 bln
-32.753 bln
-18.3%
jan 1, 1999
146.948 bln
+705.0 mln
0.48%
jan 1, 2000
158.214 bln
+11.266 bln
7.67%
jan 1, 2001
202.589 bln
+44.375 bln
28.05%
jan 1, 2002
217.96 bln
+15.371 bln
7.59%
jan 1, 2003
255.97 bln
+38.01 bln
17.44%
jan 1, 2004
462.071 bln
+206.1 bln
80.52%
jan 1, 2005
625.332 bln
+163.261 bln
35.33%
jan 1, 2006
812.612 bln
+187.28 bln
29.95%
jan 1, 2007
1.046 trl
+233.683 bln
28.76%
jan 1, 2008
1.341 trl
+294.234 bln
28.12%
jan 1, 2009
1.607 trl
+266.575 bln
19.89%
jan 1, 2010
1.358 trl
-249.13 bln
-15.5%
jan 1, 2011
1.746 trl
+388.394 bln
28.6%
jan 1, 2012
2.153 trl
+406.751 bln
23.29%
jan 1, 2013
2.342 trl
+189.009 bln
8.78%
jan 1, 2014
2.54 trl
+197.439 bln
8.43%
jan 1, 2015
2.764 trl
+224.043 bln
8.82%
jan 1, 2016
2.657 trl
-106.513 bln
-3.85%
Ranking of countries by current statistics by years


Comments: