29
/
en
AIzaSyAYiBZKx7MnpbEhh9jyipgxe19OcubqV5w
April 1, 2024
54037
Pacific island small states
PSS
false
2
1
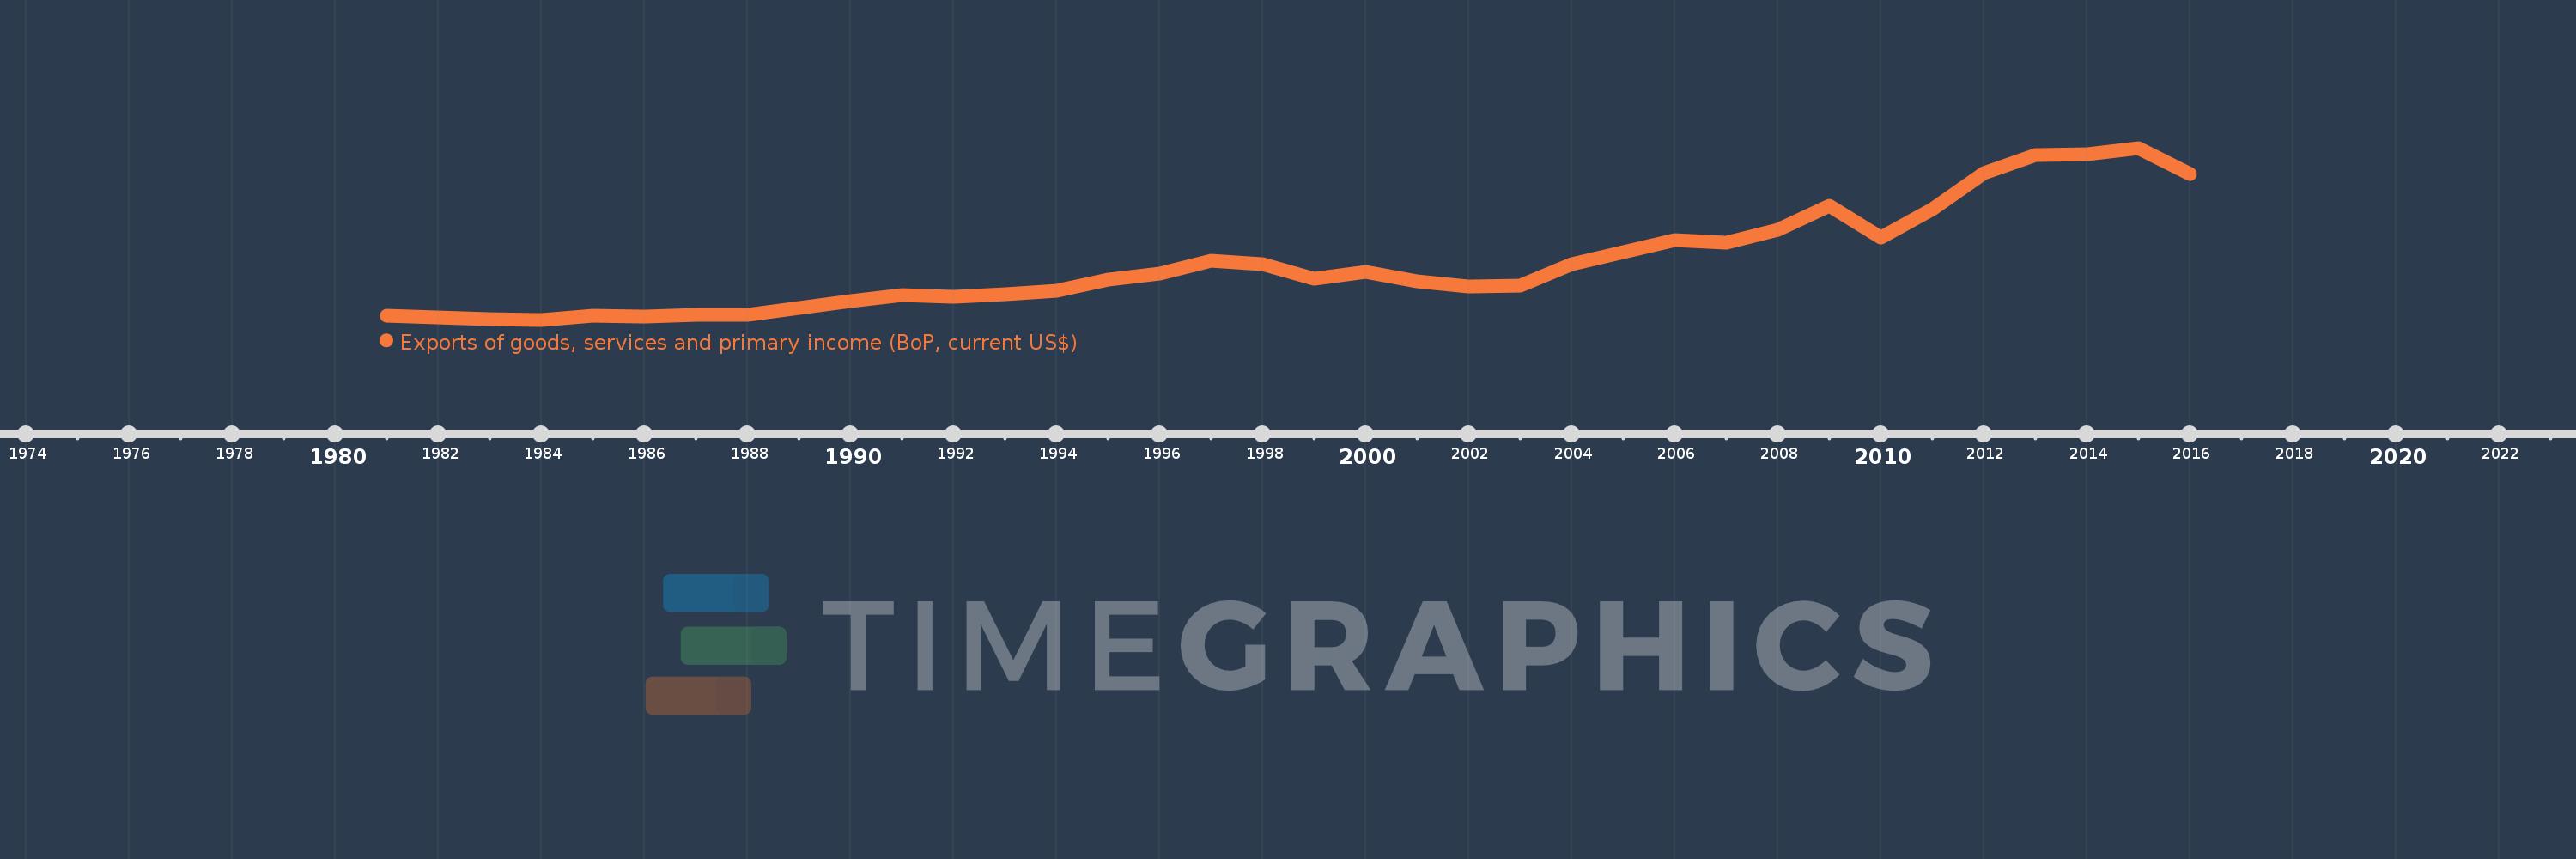
Exports of goods, services and primary income (BoP, current US$)
2016,2015,2014,2013,2012,2011,2010,2009,2008,2007,2006,2005,2004,2003,2002,2001,2000,1999,1998,1997,1996,1995,1994,1993,1992,1991,1990,1989,1988,1987,1986,1985,1984,1983,1982,1981
This statistics in other country:
AfghanistanAlbaniaAlgeriaAngolaAntigua and BarbudaArab WorldArgentinaArmeniaArubaAustraliaAustriaAzerbaijanBahamas, TheBahrainBangladeshBarbadosBelarusBelgiumBelizeBeninBermudaBhutanBoliviaBosnia and HerzegovinaBotswanaBrazilBrunei DarussalamBulgariaBurkina FasoBurundiCabo VerdeCambodiaCameroonCanadaCaribbean small statesCentral African RepublicCentral Europe and the BalticsChadChileChinaColombiaComorosCongo, Dem. Rep.Congo, Rep.Costa RicaCote d'IvoireCroatiaCuracaoCyprusCzech RepublicDenmarkDjiboutiDominicaDominican RepublicEarly-demographic dividendEast Asia & PacificEast Asia & Pacific (excluding high income)East Asia & Pacific (IDA & IBRD countries)EcuadorEgypt, Arab Rep.El SalvadorEquatorial GuineaEritreaEstoniaEthiopiaEuro areaEurope & Central AsiaEurope & Central Asia (excluding high income)Europe & Central Asia (IDA & IBRD countries)European UnionFaroe IslandsFijiFinlandFragile and conflict affected situationsFranceFrench PolynesiaGabonGambia, TheGeorgiaGermanyGhanaGreeceGrenadaGuatemalaGuineaGuinea-BissauGuyanaHaitiHeavily indebted poor countries (HIPC)High incomeHondurasHong Kong SAR, ChinaHungaryIBRD onlyIcelandIDA & IBRD totalIDA blendIDA onlyIDA totalIndiaIndonesiaIran, Islamic Rep.IraqIrelandIsraelItalyJamaicaJapanJordanKazakhstanKenyaKiribatiKorea, Rep.KosovoKuwaitKyrgyz RepublicLao PDRLate-demographic dividendLatin America & Caribbean Latin America & Caribbean (excluding high income)Latin America & the Caribbean (IDA & IBRD countries)LatviaLeast developed countries: UN classificationLebanonLesothoLiberiaLibyaLithuaniaLow & middle incomeLow incomeLower middle incomeLuxembourgMacao SAR, ChinaMacedonia, FYRMadagascarMalawiMalaysiaMaldivesMaliMaltaMarshall IslandsMauritaniaMauritiusMexicoMicronesia, Fed. Sts.Middle East & North Africa (excluding high income)Middle East & North Africa (IDA & IBRD countries)Middle incomeMoldovaMongoliaMontenegroMoroccoMozambiqueMyanmarNamibiaNepalNetherlandsNew CaledoniaNicaraguaNigerNigeriaNorth AmericaNorwayOECD membersOmanPacific island small statesPakistanPalauPanamaPapua New GuineaParaguayPeruPhilippinesPolandPortugalPost-demographic dividendPre-demographic dividendQatarRomaniaRussian FederationRwandaSamoaSao Tome and PrincipeSaudi ArabiaSenegalSerbiaSeychellesSierra LeoneSingaporeSint Maarten (Dutch part)Slovak RepublicSloveniaSolomon IslandsSouth AfricaSouth AsiaSouth Asia (IDA & IBRD)South SudanSpainSri LankaSt. Kitts and NevisSt. LuciaSt. Vincent and the GrenadinesSub-Saharan Africa Sub-Saharan Africa (excluding high income)Sub-Saharan Africa (IDA & IBRD countries)SudanSurinameSwazilandSwedenSwitzerlandSyrian Arab RepublicTajikistanTanzaniaThailandTimor-LesteTogoTongaTrinidad and TobagoTunisiaTurkeyTuvaluUgandaUkraineUnited KingdomUnited StatesUpper middle incomeUruguayVanuatuVenezuela, RBVietnamWest Bank and GazaWorldYemen, Rep.ZambiaZimbabwe Timeline:
This timeline shows a graph from 1981 to 2016 of Pacific island small states. No data until 1980. Number of actual observations by date: 36.
Source name:
World Development Indicators
Source organization:
International Monetary Fund, Balance of Payments Statistics Yearbook and data files.
Categories, topics:
Economy & Growth, External Debt, Trade
Last updated:
apr 23, 2017
Indicators value changes by year
Minimum:
813.91 mln
jan 1, 1984
Maximum:
4.718 bln
jan 1, 2015
At the date of observation
Value
Absolute change
Change from previous value
jan 1, 1981
906.237 mln
+906.237 mln
0.0%
jan 1, 1982
861.358 mln
-44.878 mln
-4.95%
jan 1, 1983
831.678 mln
-29.681 mln
-3.45%
jan 1, 1984
813.91 mln
-17.768 mln
-2.14%
jan 1, 1985
903.792 mln
+89.882 mln
11.04%
jan 1, 1986
887.389 mln
-16.403 mln
-1.81%
jan 1, 1987
924.614 mln
+37.225 mln
4.19%
jan 1, 1988
934.9 mln
+10.286 mln
1.11%
jan 1, 1989
1.082 bln
+147.367 mln
15.76%
jan 1, 1990
1.242 bln
+159.772 mln
14.76%
jan 1, 1991
1.375 bln
+132.776 mln
10.69%
jan 1, 1992
1.344 bln
-31.104 mln
-2.26%
jan 1, 1993
1.386 bln
+41.996 mln
3.13%
jan 1, 1994
1.473 bln
+87.676 mln
6.33%
jan 1, 1995
1.722 bln
+248.816 mln
16.89%
jan 1, 1996
1.856 bln
+133.768 mln
7.77%
jan 1, 1997
2.147 bln
+291.491 mln
15.71%
jan 1, 1998
2.068 bln
-79.548 mln
-3.7%
jan 1, 1999
1.737 bln
-331.298 mln
-16.02%
jan 1, 2000
1.901 bln
+164.541 mln
9.47%
jan 1, 2001
1.683 bln
-218.102 mln
-11.47%
jan 1, 2002
1.571 bln
-112.402 mln
-6.68%
jan 1, 2003
1.596 bln
+24.981 mln
1.59%
jan 1, 2004
2.082 bln
+486.46 mln
30.49%
jan 1, 2005
2.353 bln
+270.82 mln
13.01%
jan 1, 2006
2.624 bln
+271.56 mln
11.54%
jan 1, 2007
2.559 bln
-65.529 mln
-2.5%
jan 1, 2008
2.858 bln
+299.167 mln
11.69%
jan 1, 2009
3.401 bln
+543.063 mln
19.0%
jan 1, 2010
2.69 bln
-711.649 mln
-20.92%
jan 1, 2011
3.329 bln
+639.795 mln
23.79%
jan 1, 2012
4.146 bln
+817.039 mln
24.54%
jan 1, 2013
4.562 bln
+415.705 mln
10.03%
jan 1, 2014
4.578 bln
+16.059 mln
0.35%
jan 1, 2015
4.718 bln
+139.67 mln
3.05%
jan 1, 2016
4.129 bln
-588.447 mln
-12.47%
Ranking of countries by current statistics by years


Comments: