29
/
en
AIzaSyAYiBZKx7MnpbEhh9jyipgxe19OcubqV5w
April 1, 2024
28074
East Asia & Pacific (excluding high income)
EAP
false
2
1
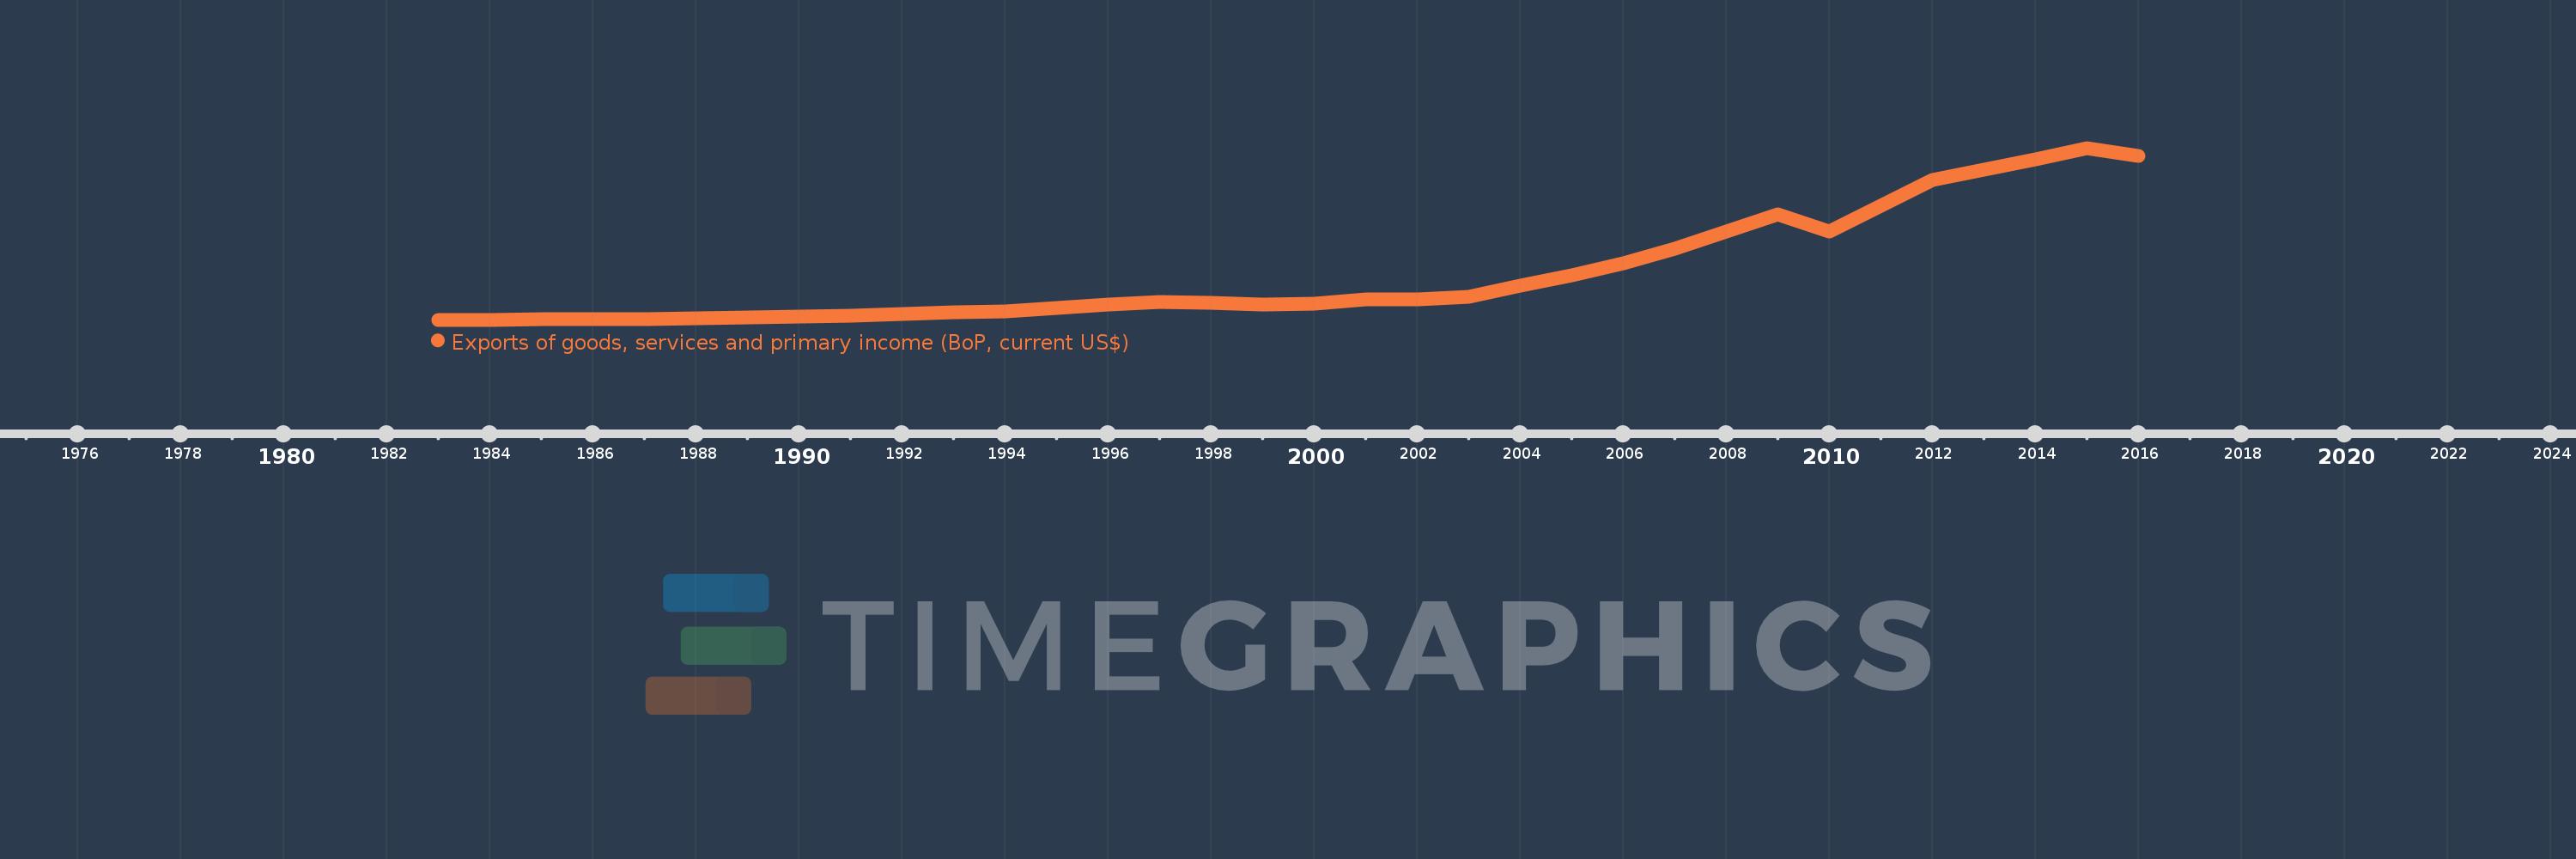
Exports of goods, services and primary income (BoP, current US$)
2016,2015,2014,2013,2012,2011,2010,2009,2008,2007,2006,2005,2004,2003,2002,2001,2000,1999,1998,1997,1996,1995,1994,1993,1992,1991,1990,1989,1988,1987,1986,1985,1984,1983
This statistics in other country:
AfghanistanAlbaniaAlgeriaAngolaAntigua and BarbudaArab WorldArgentinaArmeniaArubaAustraliaAustriaAzerbaijanBahamas, TheBahrainBangladeshBarbadosBelarusBelgiumBelizeBeninBermudaBhutanBoliviaBosnia and HerzegovinaBotswanaBrazilBrunei DarussalamBulgariaBurkina FasoBurundiCabo VerdeCambodiaCameroonCanadaCaribbean small statesCentral African RepublicCentral Europe and the BalticsChadChileChinaColombiaComorosCongo, Dem. Rep.Congo, Rep.Costa RicaCote d'IvoireCroatiaCuracaoCyprusCzech RepublicDenmarkDjiboutiDominicaDominican RepublicEarly-demographic dividendEast Asia & PacificEast Asia & Pacific (excluding high income)East Asia & Pacific (IDA & IBRD countries)EcuadorEgypt, Arab Rep.El SalvadorEquatorial GuineaEritreaEstoniaEthiopiaEuro areaEurope & Central AsiaEurope & Central Asia (excluding high income)Europe & Central Asia (IDA & IBRD countries)European UnionFaroe IslandsFijiFinlandFragile and conflict affected situationsFranceFrench PolynesiaGabonGambia, TheGeorgiaGermanyGhanaGreeceGrenadaGuatemalaGuineaGuinea-BissauGuyanaHaitiHeavily indebted poor countries (HIPC)High incomeHondurasHong Kong SAR, ChinaHungaryIBRD onlyIcelandIDA & IBRD totalIDA blendIDA onlyIDA totalIndiaIndonesiaIran, Islamic Rep.IraqIrelandIsraelItalyJamaicaJapanJordanKazakhstanKenyaKiribatiKorea, Rep.KosovoKuwaitKyrgyz RepublicLao PDRLate-demographic dividendLatin America & Caribbean Latin America & Caribbean (excluding high income)Latin America & the Caribbean (IDA & IBRD countries)LatviaLeast developed countries: UN classificationLebanonLesothoLiberiaLibyaLithuaniaLow & middle incomeLow incomeLower middle incomeLuxembourgMacao SAR, ChinaMacedonia, FYRMadagascarMalawiMalaysiaMaldivesMaliMaltaMarshall IslandsMauritaniaMauritiusMexicoMicronesia, Fed. Sts.Middle East & North Africa (excluding high income)Middle East & North Africa (IDA & IBRD countries)Middle incomeMoldovaMongoliaMontenegroMoroccoMozambiqueMyanmarNamibiaNepalNetherlandsNew CaledoniaNicaraguaNigerNigeriaNorth AmericaNorwayOECD membersOmanPacific island small statesPakistanPalauPanamaPapua New GuineaParaguayPeruPhilippinesPolandPortugalPost-demographic dividendPre-demographic dividendQatarRomaniaRussian FederationRwandaSamoaSao Tome and PrincipeSaudi ArabiaSenegalSerbiaSeychellesSierra LeoneSingaporeSint Maarten (Dutch part)Slovak RepublicSloveniaSolomon IslandsSouth AfricaSouth AsiaSouth Asia (IDA & IBRD)South SudanSpainSri LankaSt. Kitts and NevisSt. LuciaSt. Vincent and the GrenadinesSub-Saharan Africa Sub-Saharan Africa (excluding high income)Sub-Saharan Africa (IDA & IBRD countries)SudanSurinameSwazilandSwedenSwitzerlandSyrian Arab RepublicTajikistanTanzaniaThailandTimor-LesteTogoTongaTrinidad and TobagoTunisiaTurkeyTuvaluUgandaUkraineUnited KingdomUnited StatesUpper middle incomeUruguayVanuatuVenezuela, RBVietnamWest Bank and GazaWorldYemen, Rep.ZambiaZimbabwe Timeline:
This timeline shows a graph from 1983 to 2016 of East Asia & Pacific (excluding high income). No data until 1982. Number of actual observations by date: 34.
Source name:
World Development Indicators
Source organization:
International Monetary Fund, Balance of Payments Statistics Yearbook and data files.
Categories, topics:
Economy & Growth, External Debt, Trade
Last updated:
apr 23, 2017
Indicators value changes by year
Minimum:
82.372 bln
jan 1, 1983
Maximum:
3.821 trl
jan 1, 2015
At the date of observation
Value
Absolute change
Change from previous value
jan 1, 1983
82.372 bln
+82.372 bln
0.0%
jan 1, 1984
82.779 bln
+407.203 mln
0.49%
jan 1, 1985
93.44 bln
+10.66 bln
12.88%
jan 1, 1986
90.629 bln
-2.811 bln
-3.01%
jan 1, 1987
88.894 bln
-1.735 bln
-1.91%
jan 1, 1988
110.879 bln
+21.985 bln
24.73%
jan 1, 1989
132.454 bln
+21.574 bln
19.46%
jan 1, 1990
150.492 bln
+18.038 bln
13.62%
jan 1, 1991
176.514 bln
+26.022 bln
17.29%
jan 1, 1992
203.352 bln
+26.839 bln
15.2%
jan 1, 1993
239.5 bln
+36.148 bln
17.78%
jan 1, 1994
268.115 bln
+28.615 bln
11.95%
jan 1, 1995
336.63 bln
+68.515 bln
25.55%
jan 1, 1996
416.734 bln
+80.104 bln
23.8%
jan 1, 1997
465.089 bln
+48.355 bln
11.6%
jan 1, 1998
451.814 bln
-13.275 bln
-2.85%
jan 1, 1999
421.53 bln
-30.284 bln
-6.7%
jan 1, 2000
437.749 bln
+16.219 bln
3.85%
jan 1, 2001
534.211 bln
+96.462 bln
22.04%
jan 1, 2002
523.452 bln
-10.759 bln
-2.01%
jan 1, 2003
578.913 bln
+55.461 bln
10.6%
jan 1, 2004
820.101 bln
+241.188 bln
41.66%
jan 1, 2005
1.054 trl
+233.43 bln
28.46%
jan 1, 2006
1.302 trl
+248.654 bln
23.6%
jan 1, 2007
1.619 trl
+317.275 bln
24.36%
jan 1, 2008
2.006 trl
+386.727 bln
23.88%
jan 1, 2009
2.369 trl
+362.98 bln
18.09%
jan 1, 2010
2.009 trl
-359.833 bln
-15.19%
jan 1, 2011
2.558 trl
+548.683 bln
27.31%
jan 1, 2012
3.123 trl
+565.072 bln
22.09%
jan 1, 2013
3.35 trl
+226.64 bln
7.26%
jan 1, 2014
3.568 trl
+217.954 bln
6.51%
jan 1, 2015
3.821 trl
+252.848 bln
7.09%
jan 1, 2016
3.644 trl
-176.702 bln
-4.63%
Ranking of countries by current statistics by years


Comments: