29
/
en
AIzaSyAYiBZKx7MnpbEhh9jyipgxe19OcubqV5w
April 1, 2024
147887
Guyana
GUY
true
2
1
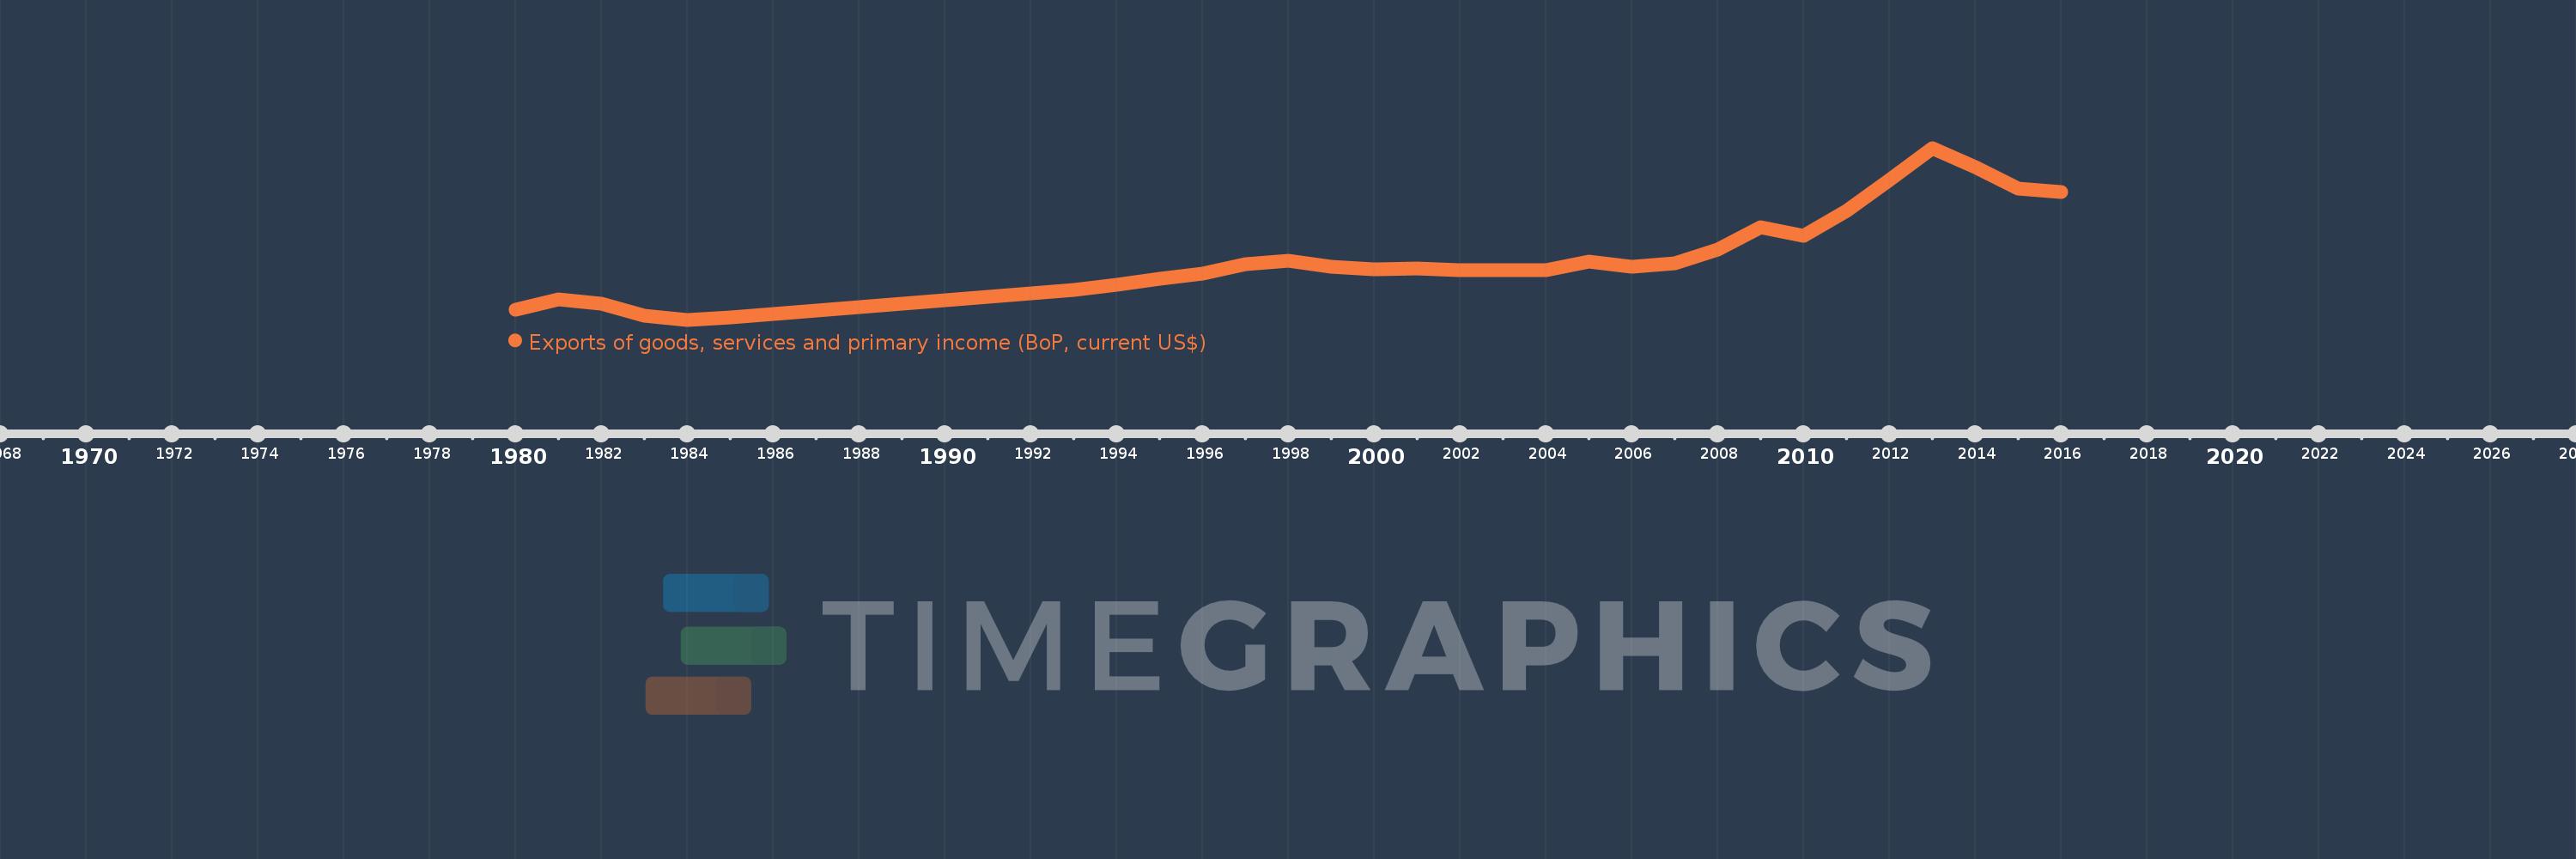
Exports of goods, services and primary income (BoP, current US$)
2016,2015,2014,2013,2012,2011,2010,2009,2008,2007,2006,2005,2004,2003,2002,2001,2000,1999,1998,1997,1996,1995,1994,1993,1985,1984,1983,1982,1981,1980
This statistics in other country:
AfghanistanAlbaniaAlgeriaAngolaAntigua and BarbudaArab WorldArgentinaArmeniaArubaAustraliaAustriaAzerbaijanBahamas, TheBahrainBangladeshBarbadosBelarusBelgiumBelizeBeninBermudaBhutanBoliviaBosnia and HerzegovinaBotswanaBrazilBrunei DarussalamBulgariaBurkina FasoBurundiCabo VerdeCambodiaCameroonCanadaCaribbean small statesCentral African RepublicCentral Europe and the BalticsChadChileChinaColombiaComorosCongo, Dem. Rep.Congo, Rep.Costa RicaCote d'IvoireCroatiaCuracaoCyprusCzech RepublicDenmarkDjiboutiDominicaDominican RepublicEarly-demographic dividendEast Asia & PacificEast Asia & Pacific (excluding high income)East Asia & Pacific (IDA & IBRD countries)EcuadorEgypt, Arab Rep.El SalvadorEquatorial GuineaEritreaEstoniaEthiopiaEuro areaEurope & Central AsiaEurope & Central Asia (excluding high income)Europe & Central Asia (IDA & IBRD countries)European UnionFaroe IslandsFijiFinlandFragile and conflict affected situationsFranceFrench PolynesiaGabonGambia, TheGeorgiaGermanyGhanaGreeceGrenadaGuatemalaGuineaGuinea-BissauGuyanaHaitiHeavily indebted poor countries (HIPC)High incomeHondurasHong Kong SAR, ChinaHungaryIBRD onlyIcelandIDA & IBRD totalIDA blendIDA onlyIDA totalIndiaIndonesiaIran, Islamic Rep.IraqIrelandIsraelItalyJamaicaJapanJordanKazakhstanKenyaKiribatiKorea, Rep.KosovoKuwaitKyrgyz RepublicLao PDRLate-demographic dividendLatin America & Caribbean Latin America & Caribbean (excluding high income)Latin America & the Caribbean (IDA & IBRD countries)LatviaLeast developed countries: UN classificationLebanonLesothoLiberiaLibyaLithuaniaLow & middle incomeLow incomeLower middle incomeLuxembourgMacao SAR, ChinaMacedonia, FYRMadagascarMalawiMalaysiaMaldivesMaliMaltaMarshall IslandsMauritaniaMauritiusMexicoMicronesia, Fed. Sts.Middle East & North Africa (excluding high income)Middle East & North Africa (IDA & IBRD countries)Middle incomeMoldovaMongoliaMontenegroMoroccoMozambiqueMyanmarNamibiaNepalNetherlandsNew CaledoniaNicaraguaNigerNigeriaNorth AmericaNorwayOECD membersOmanPacific island small statesPakistanPalauPanamaPapua New GuineaParaguayPeruPhilippinesPolandPortugalPost-demographic dividendPre-demographic dividendQatarRomaniaRussian FederationRwandaSamoaSao Tome and PrincipeSaudi ArabiaSenegalSerbiaSeychellesSierra LeoneSingaporeSint Maarten (Dutch part)Slovak RepublicSloveniaSolomon IslandsSouth AfricaSouth AsiaSouth Asia (IDA & IBRD)South SudanSpainSri LankaSt. Kitts and NevisSt. LuciaSt. Vincent and the GrenadinesSub-Saharan Africa Sub-Saharan Africa (excluding high income)Sub-Saharan Africa (IDA & IBRD countries)SudanSurinameSwazilandSwedenSwitzerlandSyrian Arab RepublicTajikistanTanzaniaThailandTimor-LesteTogoTongaTrinidad and TobagoTunisiaTurkeyTuvaluUgandaUkraineUnited KingdomUnited StatesUpper middle incomeUruguayVanuatuVenezuela, RBVietnamWest Bank and GazaWorldYemen, Rep.ZambiaZimbabwe Timeline:
This timeline shows a graph from 1980 to 2016 of Guyana. No data until 1979. Number of actual observations by date: 30.
Source name:
World Development Indicators
Source organization:
International Monetary Fund, Balance of Payments Statistics Yearbook and data files.
Categories, topics:
Economy & Growth, External Debt, Trade
Last updated:
apr 23, 2017
Indicators value changes by year
Minimum:
225.2 mln
jan 1, 1984
Maximum:
1.764 bln
jan 1, 2013
At the date of observation
Value
Absolute change
Change from previous value
jan 1, 1980
314.941 mln
+314.941 mln
0.0%
jan 1, 1981
410.51 mln
+95.569 mln
30.34%
jan 1, 1982
372.444 mln
-38.065 mln
-9.27%
jan 1, 1983
264.367 mln
-108.078 mln
-29.02%
jan 1, 1984
225.2 mln
-39.167 mln
-14.82%
jan 1, 1985
246.374 mln
+21.174 mln
9.4%
jan 1, 1993
492.492 mln
+246.118 mln
99.9%
jan 1, 1994
535.875 mln
+43.383 mln
8.81%
jan 1, 1995
592.845 mln
+56.97 mln
10.63%
jan 1, 1996
641.355 mln
+48.51 mln
8.18%
jan 1, 1997
724.0 mln
+82.645 mln
12.89%
jan 1, 1998
751.2 mln
+27.2 mln
3.76%
jan 1, 1999
698.8 mln
-52.4 mln
-6.98%
jan 1, 2000
680.5 mln
-18.3 mln
-2.62%
jan 1, 2001
683.9 mln
+3.4 mln
0.5%
jan 1, 2002
667.5 mln
-16.4 mln
-2.4%
jan 1, 2003
670.2 mln
+2.7 mln
0.4%
jan 1, 2004
669.5 mln
-700.0K
-0.1%
jan 1, 2005
748.887 mln
+79.387 mln
11.86%
jan 1, 2006
696.757 mln
-52.13 mln
-6.96%
jan 1, 2007
730.041 mln
+33.284 mln
4.78%
jan 1, 2008
850.649 mln
+120.608 mln
16.52%
jan 1, 2009
1.055 bln
+204.018 mln
23.98%
jan 1, 2010
978.287 mln
-76.379 mln
-7.24%
jan 1, 2011
1.197 bln
+218.74 mln
22.36%
jan 1, 2012
1.479 bln
+281.538 mln
23.52%
jan 1, 2013
1.764 bln
+285.479 mln
19.31%
jan 1, 2014
1.594 bln
-170.516 mln
-9.67%
jan 1, 2015
1.403 bln
-190.492 mln
-11.95%
jan 1, 2016
1.37 bln
-32.989 mln
-2.35%
Ranking of countries by current statistics by years


Comments: