29
/
en
AIzaSyAYiBZKx7MnpbEhh9jyipgxe19OcubqV5w
April 1, 2024
27244
East Asia & Pacific
EAS
false
2
1
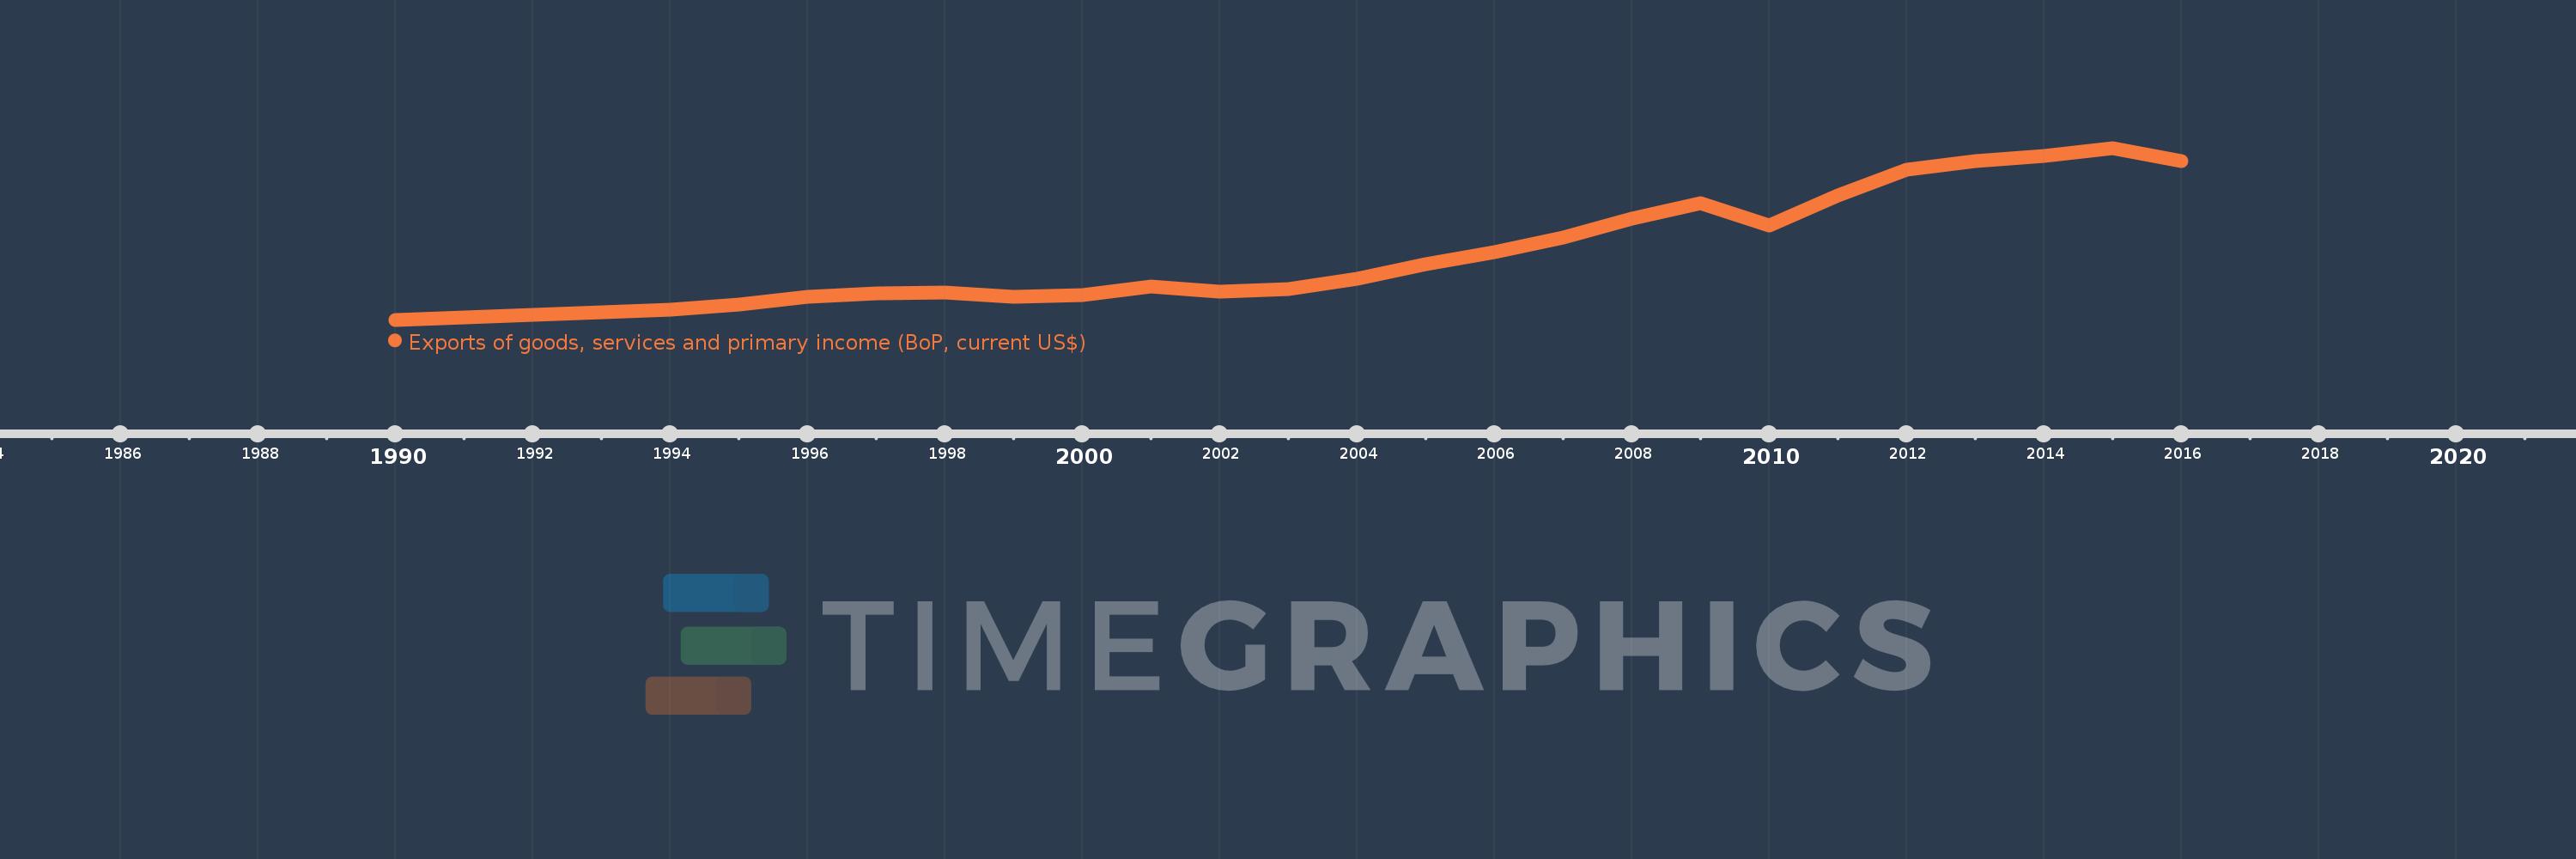
Exports of goods, services and primary income (BoP, current US$)
2016,2015,2014,2013,2012,2011,2010,2009,2008,2007,2006,2005,2004,2003,2002,2001,2000,1999,1998,1997,1996,1995,1994,1993,1992,1991,1990
This statistics in other country:
AfghanistanAlbaniaAlgeriaAngolaAntigua and BarbudaArab WorldArgentinaArmeniaArubaAustraliaAustriaAzerbaijanBahamas, TheBahrainBangladeshBarbadosBelarusBelgiumBelizeBeninBermudaBhutanBoliviaBosnia and HerzegovinaBotswanaBrazilBrunei DarussalamBulgariaBurkina FasoBurundiCabo VerdeCambodiaCameroonCanadaCaribbean small statesCentral African RepublicCentral Europe and the BalticsChadChileChinaColombiaComorosCongo, Dem. Rep.Congo, Rep.Costa RicaCote d'IvoireCroatiaCuracaoCyprusCzech RepublicDenmarkDjiboutiDominicaDominican RepublicEarly-demographic dividendEast Asia & PacificEast Asia & Pacific (excluding high income)East Asia & Pacific (IDA & IBRD countries)EcuadorEgypt, Arab Rep.El SalvadorEquatorial GuineaEritreaEstoniaEthiopiaEuro areaEurope & Central AsiaEurope & Central Asia (excluding high income)Europe & Central Asia (IDA & IBRD countries)European UnionFaroe IslandsFijiFinlandFragile and conflict affected situationsFranceFrench PolynesiaGabonGambia, TheGeorgiaGermanyGhanaGreeceGrenadaGuatemalaGuineaGuinea-BissauGuyanaHaitiHeavily indebted poor countries (HIPC)High incomeHondurasHong Kong SAR, ChinaHungaryIBRD onlyIcelandIDA & IBRD totalIDA blendIDA onlyIDA totalIndiaIndonesiaIran, Islamic Rep.IraqIrelandIsraelItalyJamaicaJapanJordanKazakhstanKenyaKiribatiKorea, Rep.KosovoKuwaitKyrgyz RepublicLao PDRLate-demographic dividendLatin America & Caribbean Latin America & Caribbean (excluding high income)Latin America & the Caribbean (IDA & IBRD countries)LatviaLeast developed countries: UN classificationLebanonLesothoLiberiaLibyaLithuaniaLow & middle incomeLow incomeLower middle incomeLuxembourgMacao SAR, ChinaMacedonia, FYRMadagascarMalawiMalaysiaMaldivesMaliMaltaMarshall IslandsMauritaniaMauritiusMexicoMicronesia, Fed. Sts.Middle East & North Africa (excluding high income)Middle East & North Africa (IDA & IBRD countries)Middle incomeMoldovaMongoliaMontenegroMoroccoMozambiqueMyanmarNamibiaNepalNetherlandsNew CaledoniaNicaraguaNigerNigeriaNorth AmericaNorwayOECD membersOmanPacific island small statesPakistanPalauPanamaPapua New GuineaParaguayPeruPhilippinesPolandPortugalPost-demographic dividendPre-demographic dividendQatarRomaniaRussian FederationRwandaSamoaSao Tome and PrincipeSaudi ArabiaSenegalSerbiaSeychellesSierra LeoneSingaporeSint Maarten (Dutch part)Slovak RepublicSloveniaSolomon IslandsSouth AfricaSouth AsiaSouth Asia (IDA & IBRD)South SudanSpainSri LankaSt. Kitts and NevisSt. LuciaSt. Vincent and the GrenadinesSub-Saharan Africa Sub-Saharan Africa (excluding high income)Sub-Saharan Africa (IDA & IBRD countries)SudanSurinameSwazilandSwedenSwitzerlandSyrian Arab RepublicTajikistanTanzaniaThailandTimor-LesteTogoTongaTrinidad and TobagoTunisiaTurkeyTuvaluUgandaUkraineUnited KingdomUnited StatesUpper middle incomeUruguayVanuatuVenezuela, RBVietnamWest Bank and GazaWorldYemen, Rep.ZambiaZimbabwe Timeline:
This timeline shows a graph from 1990 to 2016 of East Asia & Pacific. No data until 1989. Number of actual observations by date: 27.
Source name:
World Development Indicators
Source organization:
International Monetary Fund, Balance of Payments Statistics Yearbook and data files.
Categories, topics:
Economy & Growth, External Debt, Trade
Last updated:
apr 23, 2017
Indicators value changes by year
Minimum:
756.379 bln
jan 1, 1990
Maximum:
8.041 trl
jan 1, 2015
At the date of observation
Value
Absolute change
Change from previous value
jan 1, 1990
756.379 bln
+756.379 bln
0.0%
jan 1, 1991
844.877 bln
+88.498 bln
11.7%
jan 1, 1992
951.143 bln
+106.266 bln
12.58%
jan 1, 1993
1.06 trl
+108.373 bln
11.39%
jan 1, 1994
1.168 trl
+108.33 bln
10.22%
jan 1, 1995
1.399 trl
+230.969 bln
19.78%
jan 1, 1996
1.74 trl
+341.375 bln
24.4%
jan 1, 1997
1.884 trl
+144.037 bln
8.28%
jan 1, 1998
1.904 trl
+20.206 bln
1.07%
jan 1, 1999
1.736 trl
-168.434 bln
-8.84%
jan 1, 2000
1.819 trl
+83.028 bln
4.78%
jan 1, 2001
2.15 trl
+330.938 bln
18.19%
jan 1, 2002
1.962 trl
-187.847 bln
-8.74%
jan 1, 2003
2.06 trl
+97.875 bln
4.99%
jan 1, 2004
2.509 trl
+449.378 bln
21.81%
jan 1, 2005
3.123 trl
+613.136 bln
24.43%
jan 1, 2006
3.621 trl
+498.449 bln
15.96%
jan 1, 2007
4.258 trl
+637.442 bln
17.6%
jan 1, 2008
5.028 trl
+769.793 bln
18.08%
jan 1, 2009
5.701 trl
+672.678 bln
13.38%
jan 1, 2010
4.753 trl
-947.661 bln
-16.62%
jan 1, 2011
6.043 trl
+1.29 trl
27.14%
jan 1, 2012
7.132 trl
+1.089 trl
18.01%
jan 1, 2013
7.486 trl
+354.555 bln
4.97%
jan 1, 2014
7.716 trl
+230.116 bln
3.07%
jan 1, 2015
8.041 trl
+324.326 bln
4.2%
jan 1, 2016
7.481 trl
-559.414 bln
-6.96%
Ranking of countries by current statistics by years


Comments: