29
/
en
AIzaSyAYiBZKx7MnpbEhh9jyipgxe19OcubqV5w
April 1, 2024
29817
Euro area
EMU
false
2
1
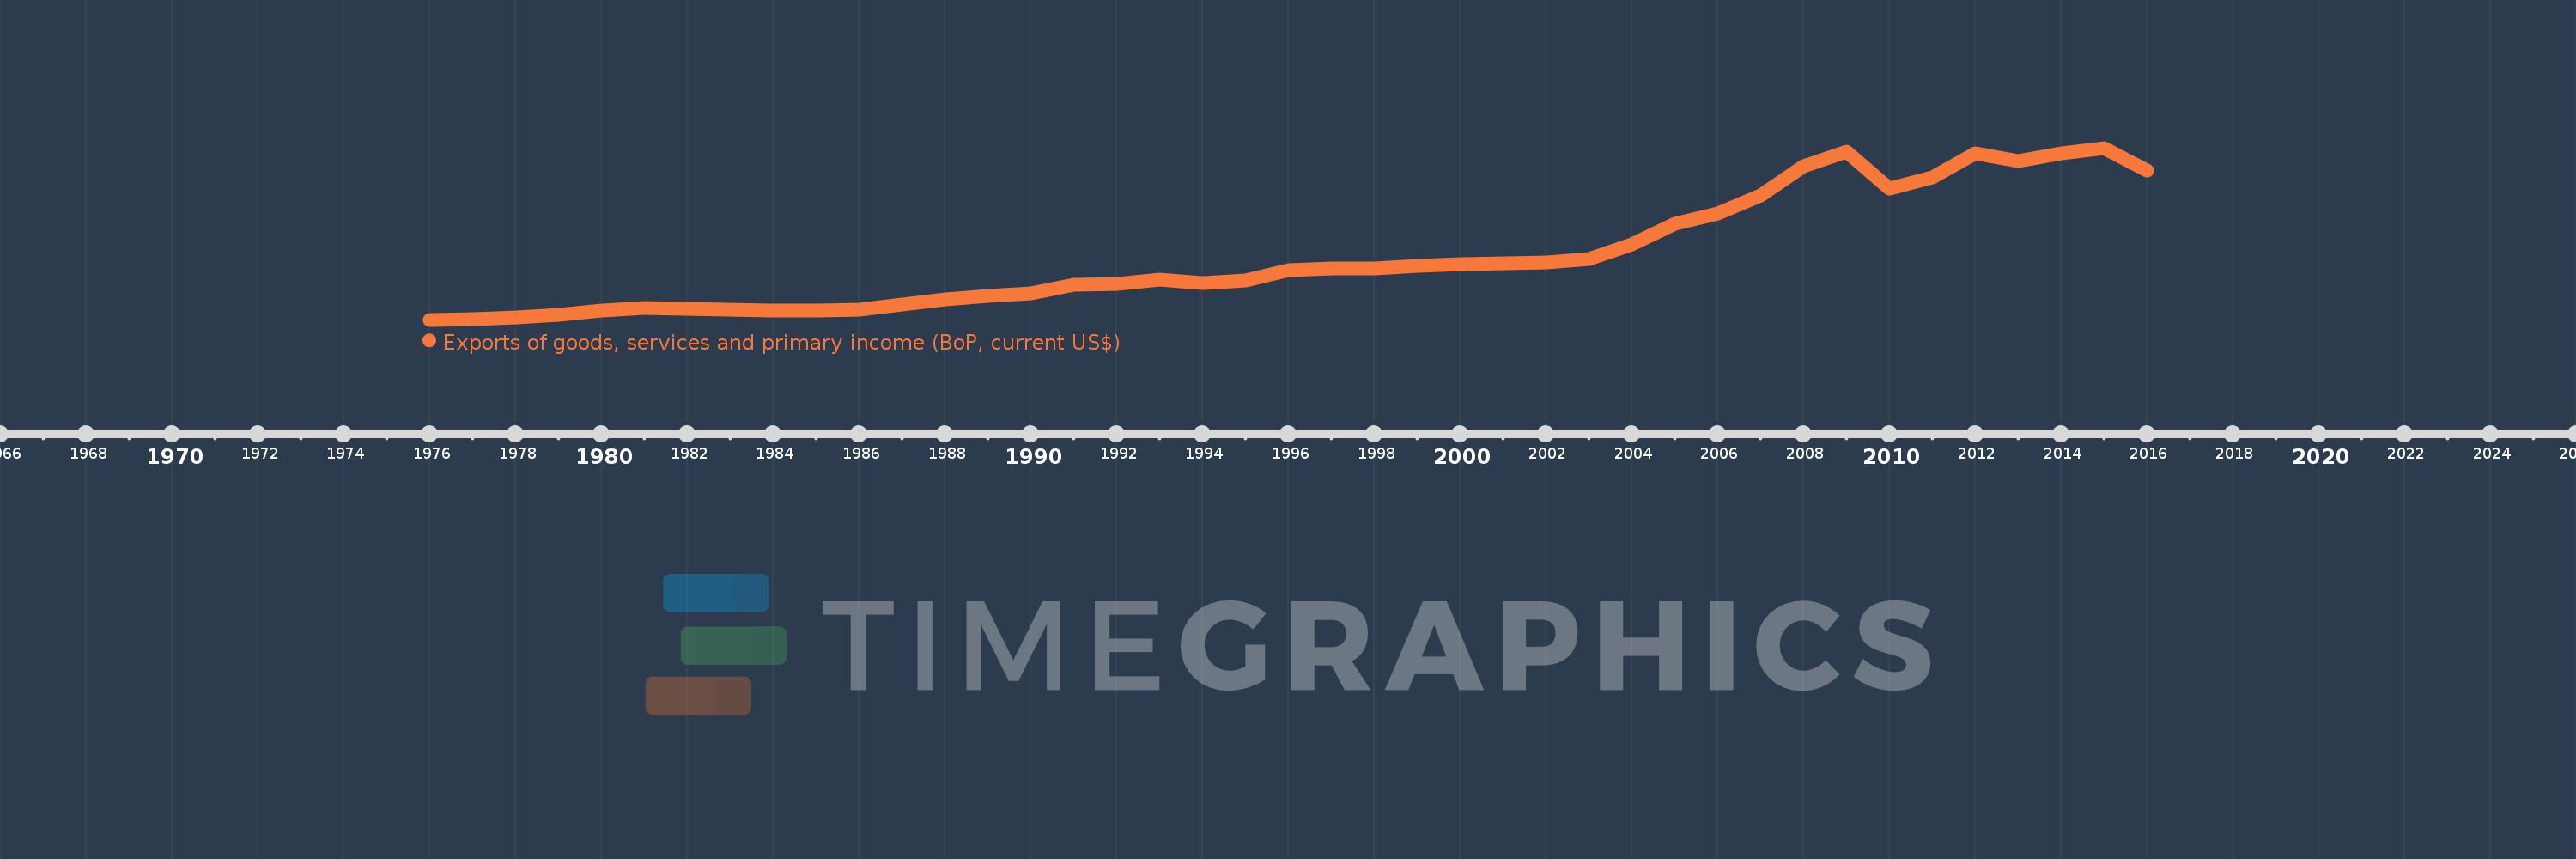
Exports of goods, services and primary income (BoP, current US$)
2016,2015,2014,2013,2012,2011,2010,2009,2008,2007,2006,2005,2004,2003,2002,2001,2000,1999,1998,1997,1996,1995,1994,1993,1992,1991,1990,1989,1988,1987,1986,1985,1984,1983,1982,1981,1980,1979,1978,1977,1976
This statistics in other country:
AfghanistanAlbaniaAlgeriaAngolaAntigua and BarbudaArab WorldArgentinaArmeniaArubaAustraliaAustriaAzerbaijanBahamas, TheBahrainBangladeshBarbadosBelarusBelgiumBelizeBeninBermudaBhutanBoliviaBosnia and HerzegovinaBotswanaBrazilBrunei DarussalamBulgariaBurkina FasoBurundiCabo VerdeCambodiaCameroonCanadaCaribbean small statesCentral African RepublicCentral Europe and the BalticsChadChileChinaColombiaComorosCongo, Dem. Rep.Congo, Rep.Costa RicaCote d'IvoireCroatiaCuracaoCyprusCzech RepublicDenmarkDjiboutiDominicaDominican RepublicEarly-demographic dividendEast Asia & PacificEast Asia & Pacific (excluding high income)East Asia & Pacific (IDA & IBRD countries)EcuadorEgypt, Arab Rep.El SalvadorEquatorial GuineaEritreaEstoniaEthiopiaEuro areaEurope & Central AsiaEurope & Central Asia (excluding high income)Europe & Central Asia (IDA & IBRD countries)European UnionFaroe IslandsFijiFinlandFragile and conflict affected situationsFranceFrench PolynesiaGabonGambia, TheGeorgiaGermanyGhanaGreeceGrenadaGuatemalaGuineaGuinea-BissauGuyanaHaitiHeavily indebted poor countries (HIPC)High incomeHondurasHong Kong SAR, ChinaHungaryIBRD onlyIcelandIDA & IBRD totalIDA blendIDA onlyIDA totalIndiaIndonesiaIran, Islamic Rep.IraqIrelandIsraelItalyJamaicaJapanJordanKazakhstanKenyaKiribatiKorea, Rep.KosovoKuwaitKyrgyz RepublicLao PDRLate-demographic dividendLatin America & Caribbean Latin America & Caribbean (excluding high income)Latin America & the Caribbean (IDA & IBRD countries)LatviaLeast developed countries: UN classificationLebanonLesothoLiberiaLibyaLithuaniaLow & middle incomeLow incomeLower middle incomeLuxembourgMacao SAR, ChinaMacedonia, FYRMadagascarMalawiMalaysiaMaldivesMaliMaltaMarshall IslandsMauritaniaMauritiusMexicoMicronesia, Fed. Sts.Middle East & North Africa (excluding high income)Middle East & North Africa (IDA & IBRD countries)Middle incomeMoldovaMongoliaMontenegroMoroccoMozambiqueMyanmarNamibiaNepalNetherlandsNew CaledoniaNicaraguaNigerNigeriaNorth AmericaNorwayOECD membersOmanPacific island small statesPakistanPalauPanamaPapua New GuineaParaguayPeruPhilippinesPolandPortugalPost-demographic dividendPre-demographic dividendQatarRomaniaRussian FederationRwandaSamoaSao Tome and PrincipeSaudi ArabiaSenegalSerbiaSeychellesSierra LeoneSingaporeSint Maarten (Dutch part)Slovak RepublicSloveniaSolomon IslandsSouth AfricaSouth AsiaSouth Asia (IDA & IBRD)South SudanSpainSri LankaSt. Kitts and NevisSt. LuciaSt. Vincent and the GrenadinesSub-Saharan Africa Sub-Saharan Africa (excluding high income)Sub-Saharan Africa (IDA & IBRD countries)SudanSurinameSwazilandSwedenSwitzerlandSyrian Arab RepublicTajikistanTanzaniaThailandTimor-LesteTogoTongaTrinidad and TobagoTunisiaTurkeyTuvaluUgandaUkraineUnited KingdomUnited StatesUpper middle incomeUruguayVanuatuVenezuela, RBVietnamWest Bank and GazaWorldYemen, Rep.ZambiaZimbabwe Timeline:
This timeline shows a graph from 1976 to 2016 of Euro area. No data until 1975. Number of actual observations by date: 41.
Source name:
World Development Indicators
Source organization:
International Monetary Fund, Balance of Payments Statistics Yearbook and data files.
Categories, topics:
Economy & Growth, External Debt, Trade
Last updated:
apr 23, 2017
Indicators value changes by year
Minimum:
377.884 bln
jan 1, 1976
Maximum:
7.48 trl
jan 1, 2015
At the date of observation
Value
Absolute change
Change from previous value
jan 1, 1976
377.884 bln
+377.884 bln
0.0%
jan 1, 1977
416.885 bln
+39.002 bln
10.32%
jan 1, 1978
482.695 bln
+65.809 bln
15.79%
jan 1, 1979
592.359 bln
+109.664 bln
22.72%
jan 1, 1980
745.624 bln
+153.265 bln
25.87%
jan 1, 1981
852.695 bln
+107.07 bln
14.36%
jan 1, 1982
814.522 bln
-38.172 bln
-4.48%
jan 1, 1983
786.397 bln
-28.125 bln
-3.45%
jan 1, 1984
752.119 bln
-34.278 bln
-4.36%
jan 1, 1985
770.955 bln
+18.836 bln
2.5%
jan 1, 1986
807.443 bln
+36.489 bln
4.73%
jan 1, 1987
1.012 trl
+204.332 bln
25.31%
jan 1, 1988
1.215 trl
+203.489 bln
20.11%
jan 1, 1989
1.363 trl
+147.413 bln
12.13%
jan 1, 1990
1.475 trl
+112.28 bln
8.24%
jan 1, 1991
1.828 trl
+353.059 bln
23.94%
jan 1, 1992
1.858 trl
+30.268 bln
1.66%
jan 1, 1993
2.035 trl
+177.056 bln
9.53%
jan 1, 1994
1.896 trl
-139.445 bln
-6.85%
jan 1, 1995
1.988 trl
+92.496 bln
4.88%
jan 1, 1996
2.43 trl
+442.007 bln
22.23%
jan 1, 1997
2.498 trl
+67.635 bln
2.78%
jan 1, 1998
2.492 trl
-6.014 bln
-0.24%
jan 1, 1999
2.611 trl
+119.3 bln
4.79%
jan 1, 2000
2.668 trl
+56.799 bln
2.18%
jan 1, 2001
2.71 trl
+42.021 bln
1.57%
jan 1, 2002
2.739 trl
+28.605 bln
1.06%
jan 1, 2003
2.895 trl
+156.376 bln
5.71%
jan 1, 2004
3.48 trl
+585.13 bln
20.21%
jan 1, 2005
4.337 trl
+857.097 bln
24.63%
jan 1, 2006
4.778 trl
+440.606 bln
10.16%
jan 1, 2007
5.517 trl
+739.068 bln
15.47%
jan 1, 2008
6.714 trl
+1.197 trl
21.7%
jan 1, 2009
7.311 trl
+596.987 bln
8.89%
jan 1, 2010
5.802 trl
-1.509 trl
-20.64%
jan 1, 2011
6.26 trl
+457.382 bln
7.88%
jan 1, 2012
7.246 trl
+986.424 bln
15.76%
jan 1, 2013
6.939 trl
-306.979 bln
-4.24%
jan 1, 2014
7.254 trl
+315.058 bln
4.54%
jan 1, 2015
7.48 trl
+225.833 bln
3.11%
jan 1, 2016
6.544 trl
-935.453 bln
-12.51%
Ranking of countries by current statistics by years


Comments: