29
/
en
AIzaSyAYiBZKx7MnpbEhh9jyipgxe19OcubqV5w
April 1, 2024
24063
Arab World
ARB
false
2
1
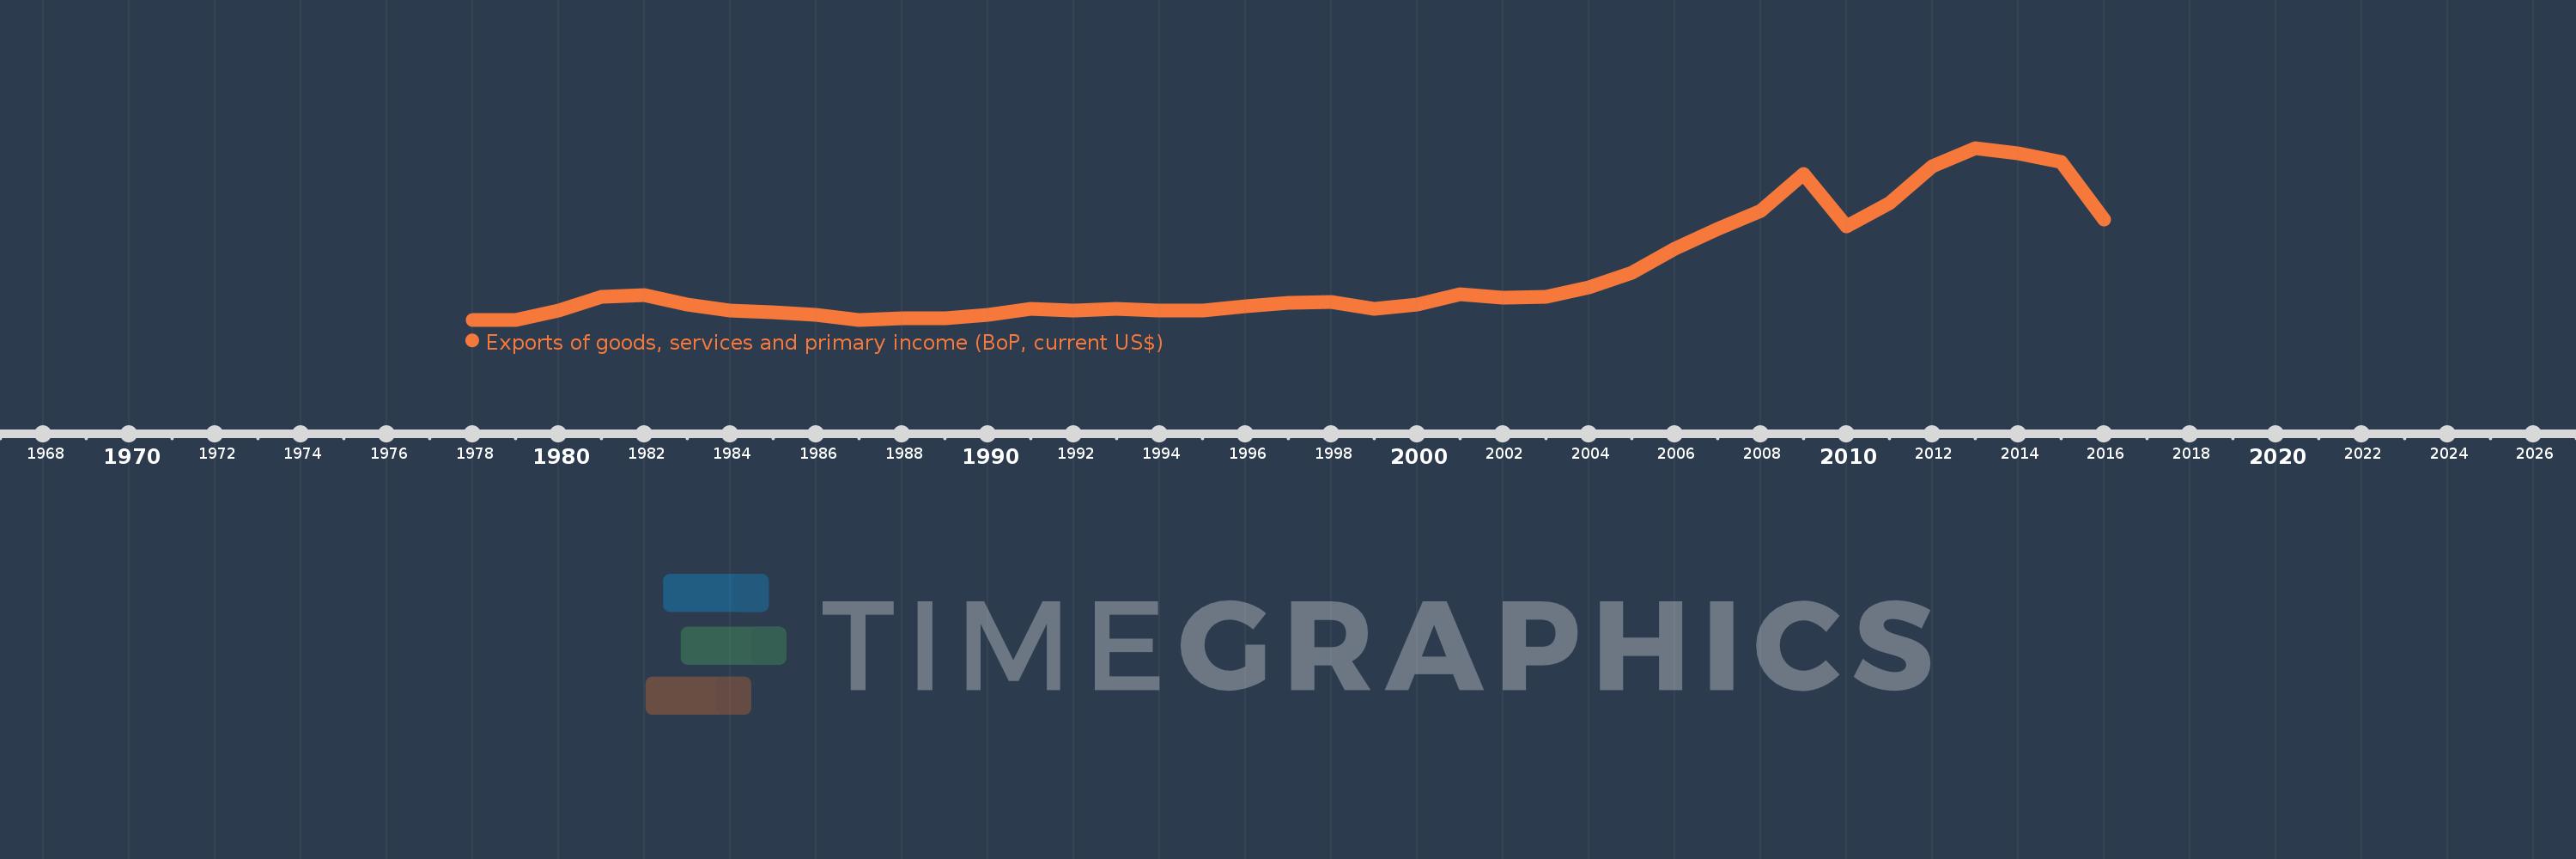
Exports of goods, services and primary income (BoP, current US$)
2016,2015,2014,2013,2012,2011,2010,2009,2008,2007,2006,2005,2004,2003,2002,2001,2000,1999,1998,1997,1996,1995,1994,1993,1992,1991,1990,1989,1988,1987,1986,1985,1984,1983,1982,1981,1980,1979,1978
This statistics in other country:
AfghanistanAlbaniaAlgeriaAngolaAntigua and BarbudaArab WorldArgentinaArmeniaArubaAustraliaAustriaAzerbaijanBahamas, TheBahrainBangladeshBarbadosBelarusBelgiumBelizeBeninBermudaBhutanBoliviaBosnia and HerzegovinaBotswanaBrazilBrunei DarussalamBulgariaBurkina FasoBurundiCabo VerdeCambodiaCameroonCanadaCaribbean small statesCentral African RepublicCentral Europe and the BalticsChadChileChinaColombiaComorosCongo, Dem. Rep.Congo, Rep.Costa RicaCote d'IvoireCroatiaCuracaoCyprusCzech RepublicDenmarkDjiboutiDominicaDominican RepublicEarly-demographic dividendEast Asia & PacificEast Asia & Pacific (excluding high income)East Asia & Pacific (IDA & IBRD countries)EcuadorEgypt, Arab Rep.El SalvadorEquatorial GuineaEritreaEstoniaEthiopiaEuro areaEurope & Central AsiaEurope & Central Asia (excluding high income)Europe & Central Asia (IDA & IBRD countries)European UnionFaroe IslandsFijiFinlandFragile and conflict affected situationsFranceFrench PolynesiaGabonGambia, TheGeorgiaGermanyGhanaGreeceGrenadaGuatemalaGuineaGuinea-BissauGuyanaHaitiHeavily indebted poor countries (HIPC)High incomeHondurasHong Kong SAR, ChinaHungaryIBRD onlyIcelandIDA & IBRD totalIDA blendIDA onlyIDA totalIndiaIndonesiaIran, Islamic Rep.IraqIrelandIsraelItalyJamaicaJapanJordanKazakhstanKenyaKiribatiKorea, Rep.KosovoKuwaitKyrgyz RepublicLao PDRLate-demographic dividendLatin America & Caribbean Latin America & Caribbean (excluding high income)Latin America & the Caribbean (IDA & IBRD countries)LatviaLeast developed countries: UN classificationLebanonLesothoLiberiaLibyaLithuaniaLow & middle incomeLow incomeLower middle incomeLuxembourgMacao SAR, ChinaMacedonia, FYRMadagascarMalawiMalaysiaMaldivesMaliMaltaMarshall IslandsMauritaniaMauritiusMexicoMicronesia, Fed. Sts.Middle East & North Africa (excluding high income)Middle East & North Africa (IDA & IBRD countries)Middle incomeMoldovaMongoliaMontenegroMoroccoMozambiqueMyanmarNamibiaNepalNetherlandsNew CaledoniaNicaraguaNigerNigeriaNorth AmericaNorwayOECD membersOmanPacific island small statesPakistanPalauPanamaPapua New GuineaParaguayPeruPhilippinesPolandPortugalPost-demographic dividendPre-demographic dividendQatarRomaniaRussian FederationRwandaSamoaSao Tome and PrincipeSaudi ArabiaSenegalSerbiaSeychellesSierra LeoneSingaporeSint Maarten (Dutch part)Slovak RepublicSloveniaSolomon IslandsSouth AfricaSouth AsiaSouth Asia (IDA & IBRD)South SudanSpainSri LankaSt. Kitts and NevisSt. LuciaSt. Vincent and the GrenadinesSub-Saharan Africa Sub-Saharan Africa (excluding high income)Sub-Saharan Africa (IDA & IBRD countries)SudanSurinameSwazilandSwedenSwitzerlandSyrian Arab RepublicTajikistanTanzaniaThailandTimor-LesteTogoTongaTrinidad and TobagoTunisiaTurkeyTuvaluUgandaUkraineUnited KingdomUnited StatesUpper middle incomeUruguayVanuatuVenezuela, RBVietnamWest Bank and GazaWorldYemen, Rep.ZambiaZimbabwe Timeline:
This timeline shows a graph from 1978 to 2016 of Arab World. No data until 1977. Number of actual observations by date: 39.
Source name:
World Development Indicators
Source organization:
International Monetary Fund, Balance of Payments Statistics Yearbook and data files.
Categories, topics:
Economy & Growth, External Debt, Trade
Last updated:
apr 23, 2017
Indicators value changes by year
Minimum:
146.76 bln
jan 1, 1978
Maximum:
1.597 trl
jan 1, 2013
At the date of observation
Value
Absolute change
Change from previous value
jan 1, 1978
146.76 bln
+146.76 bln
0.0%
jan 1, 1979
146.788 bln
+27.833 mln
0.02%
jan 1, 1980
225.086 bln
+78.298 bln
53.34%
jan 1, 1981
338.447 bln
+113.361 bln
50.36%
jan 1, 1982
356.95 bln
+18.503 bln
5.47%
jan 1, 1983
277.297 bln
-79.652 bln
-22.31%
jan 1, 1984
226.285 bln
-51.012 bln
-18.4%
jan 1, 1985
208.4 bln
-17.884 bln
-7.9%
jan 1, 1986
186.136 bln
-22.265 bln
-10.68%
jan 1, 1987
147.532 bln
-38.604 bln
-20.74%
jan 1, 1988
157.304 bln
+9.772 bln
6.62%
jan 1, 1989
162.208 bln
+4.903 bln
3.12%
jan 1, 1990
188.604 bln
+26.397 bln
16.27%
jan 1, 1991
239.032 bln
+50.427 bln
26.74%
jan 1, 1992
222.784 bln
-16.248 bln
-6.8%
jan 1, 1993
238.775 bln
+15.991 bln
7.18%
jan 1, 1994
222.421 bln
-16.354 bln
-6.85%
jan 1, 1995
226.447 bln
+4.026 bln
1.81%
jan 1, 1996
259.613 bln
+33.166 bln
14.65%
jan 1, 1997
290.232 bln
+30.619 bln
11.79%
jan 1, 1998
298.014 bln
+7.782 bln
2.68%
jan 1, 1999
236.818 bln
-61.196 bln
-20.53%
jan 1, 2000
277.779 bln
+40.96 bln
17.3%
jan 1, 2001
365.65 bln
+87.871 bln
31.63%
jan 1, 2002
334.284 bln
-31.366 bln
-8.58%
jan 1, 2003
338.611 bln
+4.327 bln
1.29%
jan 1, 2004
418.106 bln
+79.495 bln
23.48%
jan 1, 2005
541.877 bln
+123.77 bln
29.6%
jan 1, 2006
746.62 bln
+204.743 bln
37.78%
jan 1, 2007
909.865 bln
+163.246 bln
21.86%
jan 1, 2008
1.064 trl
+154.496 bln
16.98%
jan 1, 2009
1.381 trl
+316.486 bln
29.73%
jan 1, 2010
935.086 bln
-445.761 bln
-32.28%
jan 1, 2011
1.133 trl
+197.441 bln
21.11%
jan 1, 2012
1.442 trl
+309.899 bln
27.36%
jan 1, 2013
1.597 trl
+155.047 bln
10.75%
jan 1, 2014
1.552 trl
-45.111 bln
-2.82%
jan 1, 2015
1.479 trl
-73.433 bln
-4.73%
jan 1, 2016
996.574 bln
-482.355 bln
-32.62%
Ranking of countries by current statistics by years


Comments: