29
/
en
AIzaSyAYiBZKx7MnpbEhh9jyipgxe19OcubqV5w
April 1, 2024
257258
Switzerland
CHE
true
2
1
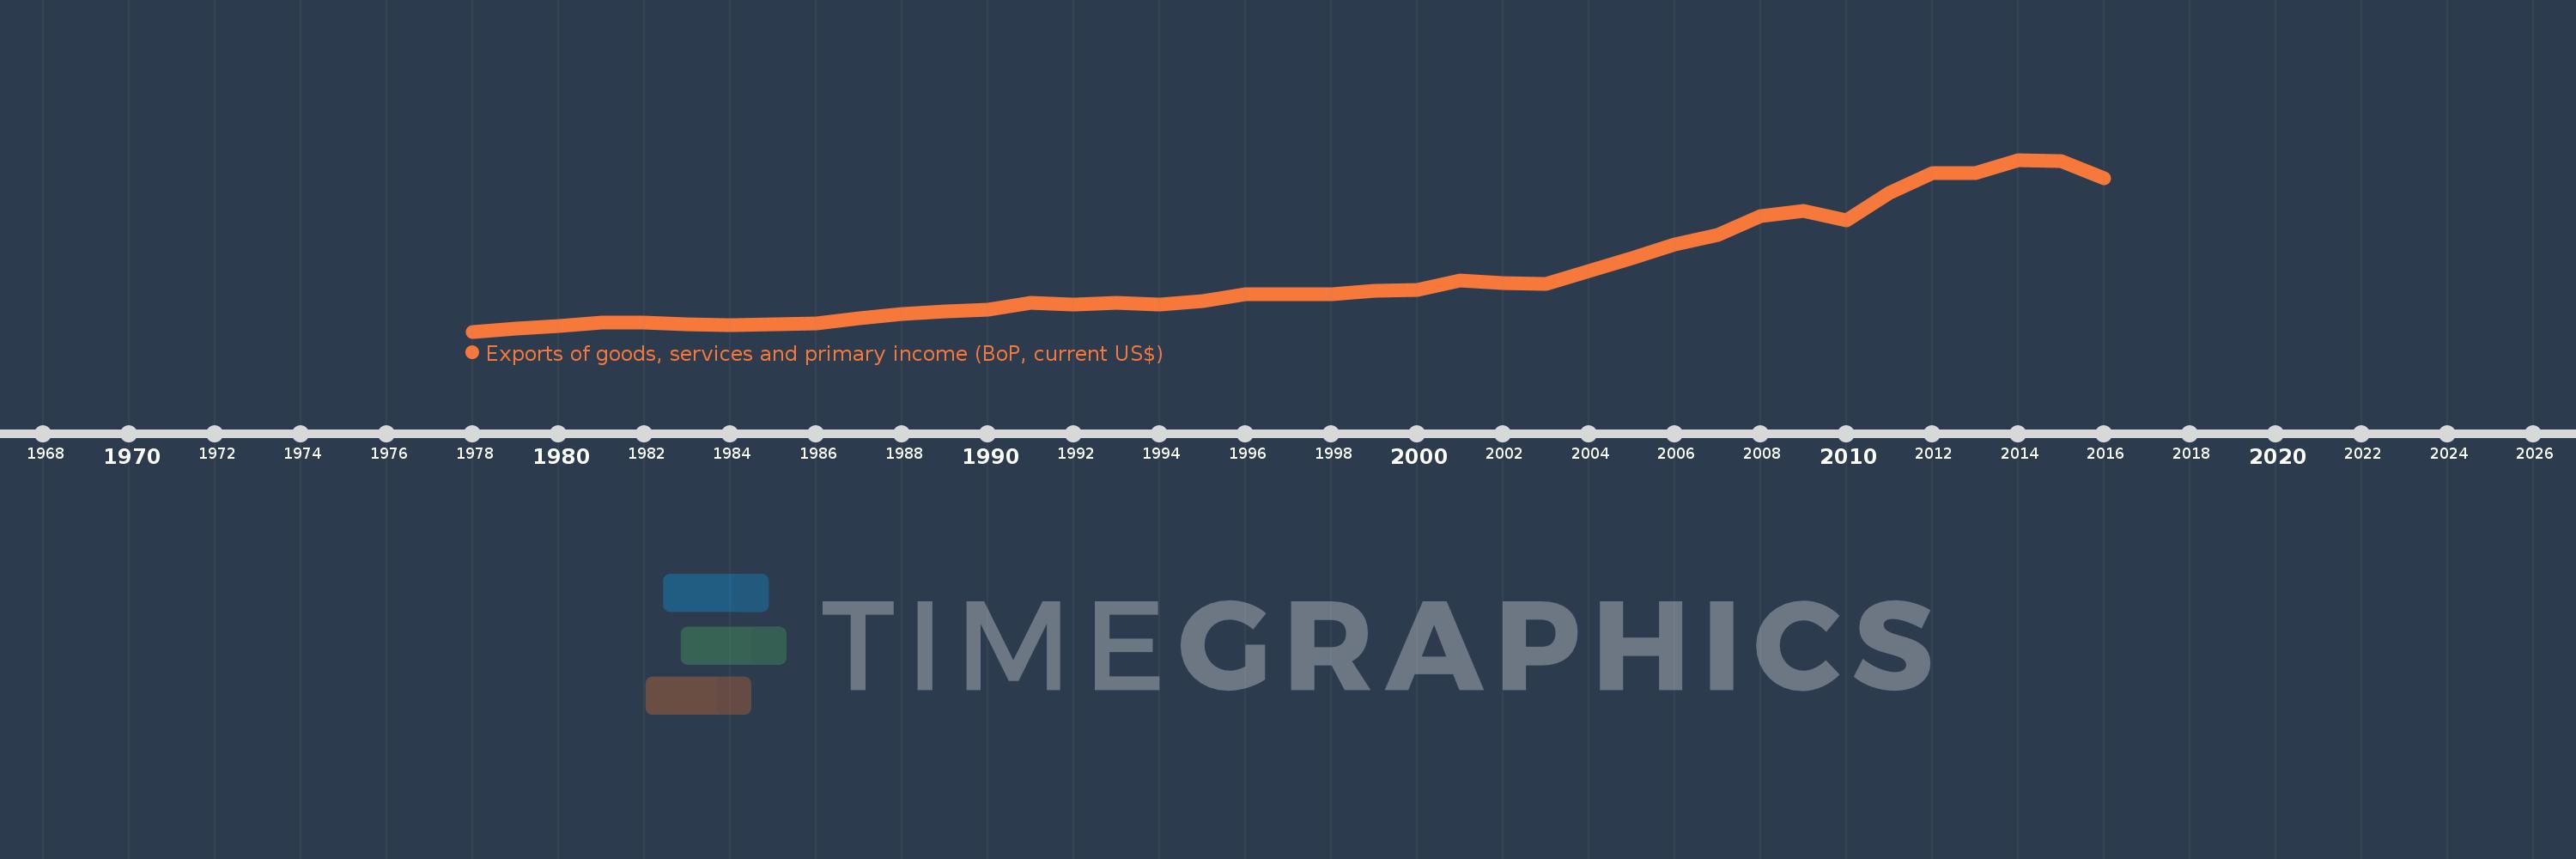
Exports of goods, services and primary income (BoP, current US$)
2016,2015,2014,2013,2012,2011,2010,2009,2008,2007,2006,2005,2004,2003,2002,2001,2000,1999,1998,1997,1996,1995,1994,1993,1992,1991,1990,1989,1988,1987,1986,1985,1984,1983,1982,1981,1980,1979,1978
This statistics in other country:
AfghanistanAlbaniaAlgeriaAngolaAntigua and BarbudaArab WorldArgentinaArmeniaArubaAustraliaAustriaAzerbaijanBahamas, TheBahrainBangladeshBarbadosBelarusBelgiumBelizeBeninBermudaBhutanBoliviaBosnia and HerzegovinaBotswanaBrazilBrunei DarussalamBulgariaBurkina FasoBurundiCabo VerdeCambodiaCameroonCanadaCaribbean small statesCentral African RepublicCentral Europe and the BalticsChadChileChinaColombiaComorosCongo, Dem. Rep.Congo, Rep.Costa RicaCote d'IvoireCroatiaCuracaoCyprusCzech RepublicDenmarkDjiboutiDominicaDominican RepublicEarly-demographic dividendEast Asia & PacificEast Asia & Pacific (excluding high income)East Asia & Pacific (IDA & IBRD countries)EcuadorEgypt, Arab Rep.El SalvadorEquatorial GuineaEritreaEstoniaEthiopiaEuro areaEurope & Central AsiaEurope & Central Asia (excluding high income)Europe & Central Asia (IDA & IBRD countries)European UnionFaroe IslandsFijiFinlandFragile and conflict affected situationsFranceFrench PolynesiaGabonGambia, TheGeorgiaGermanyGhanaGreeceGrenadaGuatemalaGuineaGuinea-BissauGuyanaHaitiHeavily indebted poor countries (HIPC)High incomeHondurasHong Kong SAR, ChinaHungaryIBRD onlyIcelandIDA & IBRD totalIDA blendIDA onlyIDA totalIndiaIndonesiaIran, Islamic Rep.IraqIrelandIsraelItalyJamaicaJapanJordanKazakhstanKenyaKiribatiKorea, Rep.KosovoKuwaitKyrgyz RepublicLao PDRLate-demographic dividendLatin America & Caribbean Latin America & Caribbean (excluding high income)Latin America & the Caribbean (IDA & IBRD countries)LatviaLeast developed countries: UN classificationLebanonLesothoLiberiaLibyaLithuaniaLow & middle incomeLow incomeLower middle incomeLuxembourgMacao SAR, ChinaMacedonia, FYRMadagascarMalawiMalaysiaMaldivesMaliMaltaMarshall IslandsMauritaniaMauritiusMexicoMicronesia, Fed. Sts.Middle East & North Africa (excluding high income)Middle East & North Africa (IDA & IBRD countries)Middle incomeMoldovaMongoliaMontenegroMoroccoMozambiqueMyanmarNamibiaNepalNetherlandsNew CaledoniaNicaraguaNigerNigeriaNorth AmericaNorwayOECD membersOmanPacific island small statesPakistanPalauPanamaPapua New GuineaParaguayPeruPhilippinesPolandPortugalPost-demographic dividendPre-demographic dividendQatarRomaniaRussian FederationRwandaSamoaSao Tome and PrincipeSaudi ArabiaSenegalSerbiaSeychellesSierra LeoneSingaporeSint Maarten (Dutch part)Slovak RepublicSloveniaSolomon IslandsSouth AfricaSouth AsiaSouth Asia (IDA & IBRD)South SudanSpainSri LankaSt. Kitts and NevisSt. LuciaSt. Vincent and the GrenadinesSub-Saharan Africa Sub-Saharan Africa (excluding high income)Sub-Saharan Africa (IDA & IBRD countries)SudanSurinameSwazilandSwedenSwitzerlandSyrian Arab RepublicTajikistanTanzaniaThailandTimor-LesteTogoTongaTrinidad and TobagoTunisiaTurkeyTuvaluUgandaUkraineUnited KingdomUnited StatesUpper middle incomeUruguayVanuatuVenezuela, RBVietnamWest Bank and GazaWorldYemen, Rep.ZambiaZimbabwe Timeline:
This timeline shows a graph from 1978 to 2016 of Switzerland. No data until 1977. Number of actual observations by date: 39.
Source name:
World Development Indicators
Source organization:
International Monetary Fund, Balance of Payments Statistics Yearbook and data files.
Categories, topics:
Economy & Growth, External Debt, Trade
Last updated:
apr 23, 2017
Indicators value changes by year
Minimum:
30.234 bln
jan 1, 1978
Maximum:
607.218 bln
jan 1, 2014
At the date of observation
Value
Absolute change
Change from previous value
jan 1, 1978
30.234 bln
+30.234 bln
0.0%
jan 1, 1979
41.348 bln
+11.114 bln
36.76%
jan 1, 1980
48.589 bln
+7.241 bln
17.51%
jan 1, 1981
59.462 bln
+10.873 bln
22.38%
jan 1, 1982
59.251 bln
-211.813 mln
-0.36%
jan 1, 1983
55.011 bln
-4.239 bln
-7.15%
jan 1, 1984
52.918 bln
-2.093 bln
-3.8%
jan 1, 1985
56.153 bln
+3.235 bln
6.11%
jan 1, 1986
57.026 bln
+873.304 mln
1.56%
jan 1, 1987
74.842 bln
+17.816 bln
31.24%
jan 1, 1988
88.355 bln
+13.513 bln
18.05%
jan 1, 1989
99.335 bln
+10.98 bln
12.43%
jan 1, 1990
104.397 bln
+5.062 bln
5.1%
jan 1, 1991
125.718 bln
+21.321 bln
20.42%
jan 1, 1992
121.694 bln
-4.024 bln
-3.2%
jan 1, 1993
127.35 bln
+5.656 bln
4.65%
jan 1, 1994
122.179 bln
-5.171 bln
-4.06%
jan 1, 1995
132.124 bln
+9.945 bln
8.14%
jan 1, 1996
154.894 bln
+22.77 bln
17.23%
jan 1, 1997
154.947 bln
+52.783 mln
0.03%
jan 1, 1998
155.529 bln
+581.92 mln
0.38%
jan 1, 1999
166.557 bln
+11.029 bln
7.09%
jan 1, 2000
170.774 bln
+4.217 bln
2.53%
jan 1, 2001
201.724 bln
+30.949 bln
18.12%
jan 1, 2002
192.74 bln
-8.983 bln
-4.45%
jan 1, 2003
189.308 bln
-3.432 bln
-1.78%
jan 1, 2004
233.25 bln
+43.942 bln
23.21%
jan 1, 2005
276.128 bln
+42.877 bln
18.38%
jan 1, 2006
322.747 bln
+46.619 bln
16.88%
jan 1, 2007
353.722 bln
+30.976 bln
9.6%
jan 1, 2008
417.437 bln
+63.714 bln
18.01%
jan 1, 2009
436.82 bln
+19.383 bln
4.64%
jan 1, 2010
404.269 bln
-32.551 bln
-7.45%
jan 1, 2011
497.118 bln
+92.849 bln
22.97%
jan 1, 2012
563.825 bln
+66.707 bln
13.42%
jan 1, 2013
562.676 bln
-1.148 bln
-0.2%
jan 1, 2014
607.218 bln
+44.541 bln
7.92%
jan 1, 2015
602.555 bln
-4.663 bln
-0.77%
jan 1, 2016
545.125 bln
-57.43 bln
-9.53%
Ranking of countries by current statistics by years


Comments: