29
/
en
AIzaSyAYiBZKx7MnpbEhh9jyipgxe19OcubqV5w
April 1, 2024
82395
Belize
BLZ
true
2
1
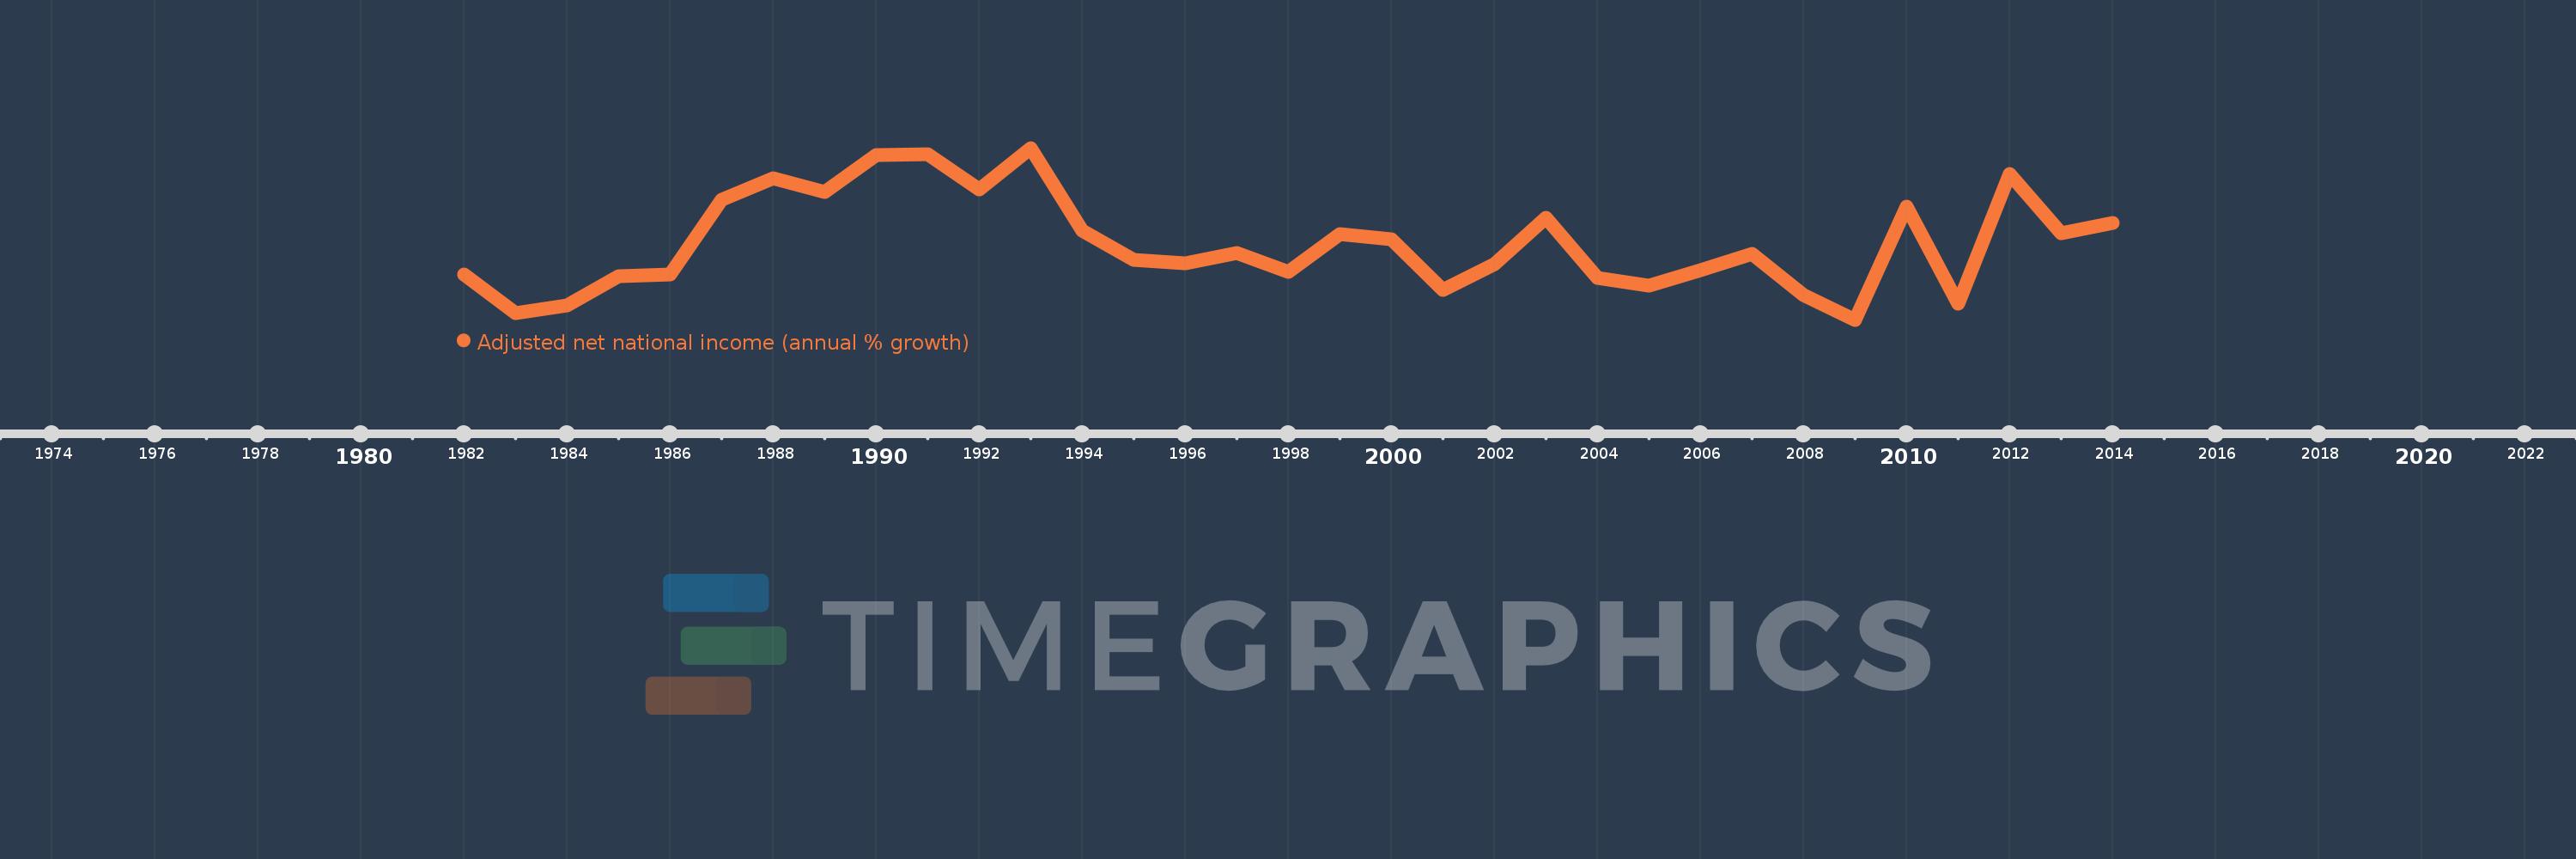
Adjusted net national income (annual % growth)
2014,2013,2012,2011,2010,2009,2008,2007,2006,2005,2004,2003,2002,2001,2000,1999,1998,1997,1996,1995,1994,1993,1992,1991,1990,1989,1988,1987,1986,1985,1984,1983,1982
This statistics in other country:
Timeline:
This timeline shows a graph from 1982 to 2014 of Belize. No data until 1981. Number of actual observations by date: 33.
Source name:
World Development Indicators
Source organization:
World Bank staff estimates based on sources and methods in World Bank's "The Changing Wealth of Nations: Measuring Sustainable Development in the New Millennium" (2011).
Categories, topics:
Economy & Growth
Last updated:
apr 23, 2017
Indicators value changes by year
Minimum:
-3.898
jan 1, 2009
Maximum:
13.495
jan 1, 1993
At the date of observation
Value
Absolute change
Change from previous value
jan 1, 1982
0.691
+0.691
0.0%
jan 1, 1983
-3.198
-3.889
-563.14%
jan 1, 1984
-2.418
+0.781
-24.41%
jan 1, 1985
0.54
+2.958
-122.35%
jan 1, 1986
0.661
+0.12
22.27%
jan 1, 1987
8.248
+7.587
1.15K%
jan 1, 1988
10.455
+2.207
26.76%
jan 1, 1989
9.059
-1.396
-13.35%
jan 1, 1990
12.769
+3.71
40.95%
jan 1, 1991
12.89
+0.121
0.95%
jan 1, 1992
9.311
-3.579
-27.77%
jan 1, 1993
13.495
+4.184
44.94%
jan 1, 1994
5.119
-8.376
-62.07%
jan 1, 1995
2.127
-2.992
-58.44%
jan 1, 1996
1.838
-0.289
-13.6%
jan 1, 1997
2.83
+0.993
54.01%
jan 1, 1998
0.982
-1.848
-65.31%
jan 1, 1999
4.799
+3.817
388.77%
jan 1, 2000
4.28
-0.52
-10.83%
jan 1, 2001
-0.897
-5.177
-120.97%
jan 1, 2002
1.694
+2.592
-288.79%
jan 1, 2003
6.435
+4.741
279.83%
jan 1, 2004
0.34
-6.095
-94.71%
jan 1, 2005
-0.443
-0.784
-230.26%
jan 1, 2006
1.139
+1.582
-356.94%
jan 1, 2007
2.786
+1.647
144.61%
jan 1, 2008
-1.423
-4.21
-151.08%
jan 1, 2009
-3.898
-2.474
173.85%
jan 1, 2010
7.579
+11.476
-294.45%
jan 1, 2011
-2.298
-9.877
-130.33%
jan 1, 2012
10.895
+13.193
-574.02%
jan 1, 2013
4.863
-6.032
-55.36%
jan 1, 2014
5.861
+0.998
20.52%
Ranking of countries by current statistics by years


Comments: