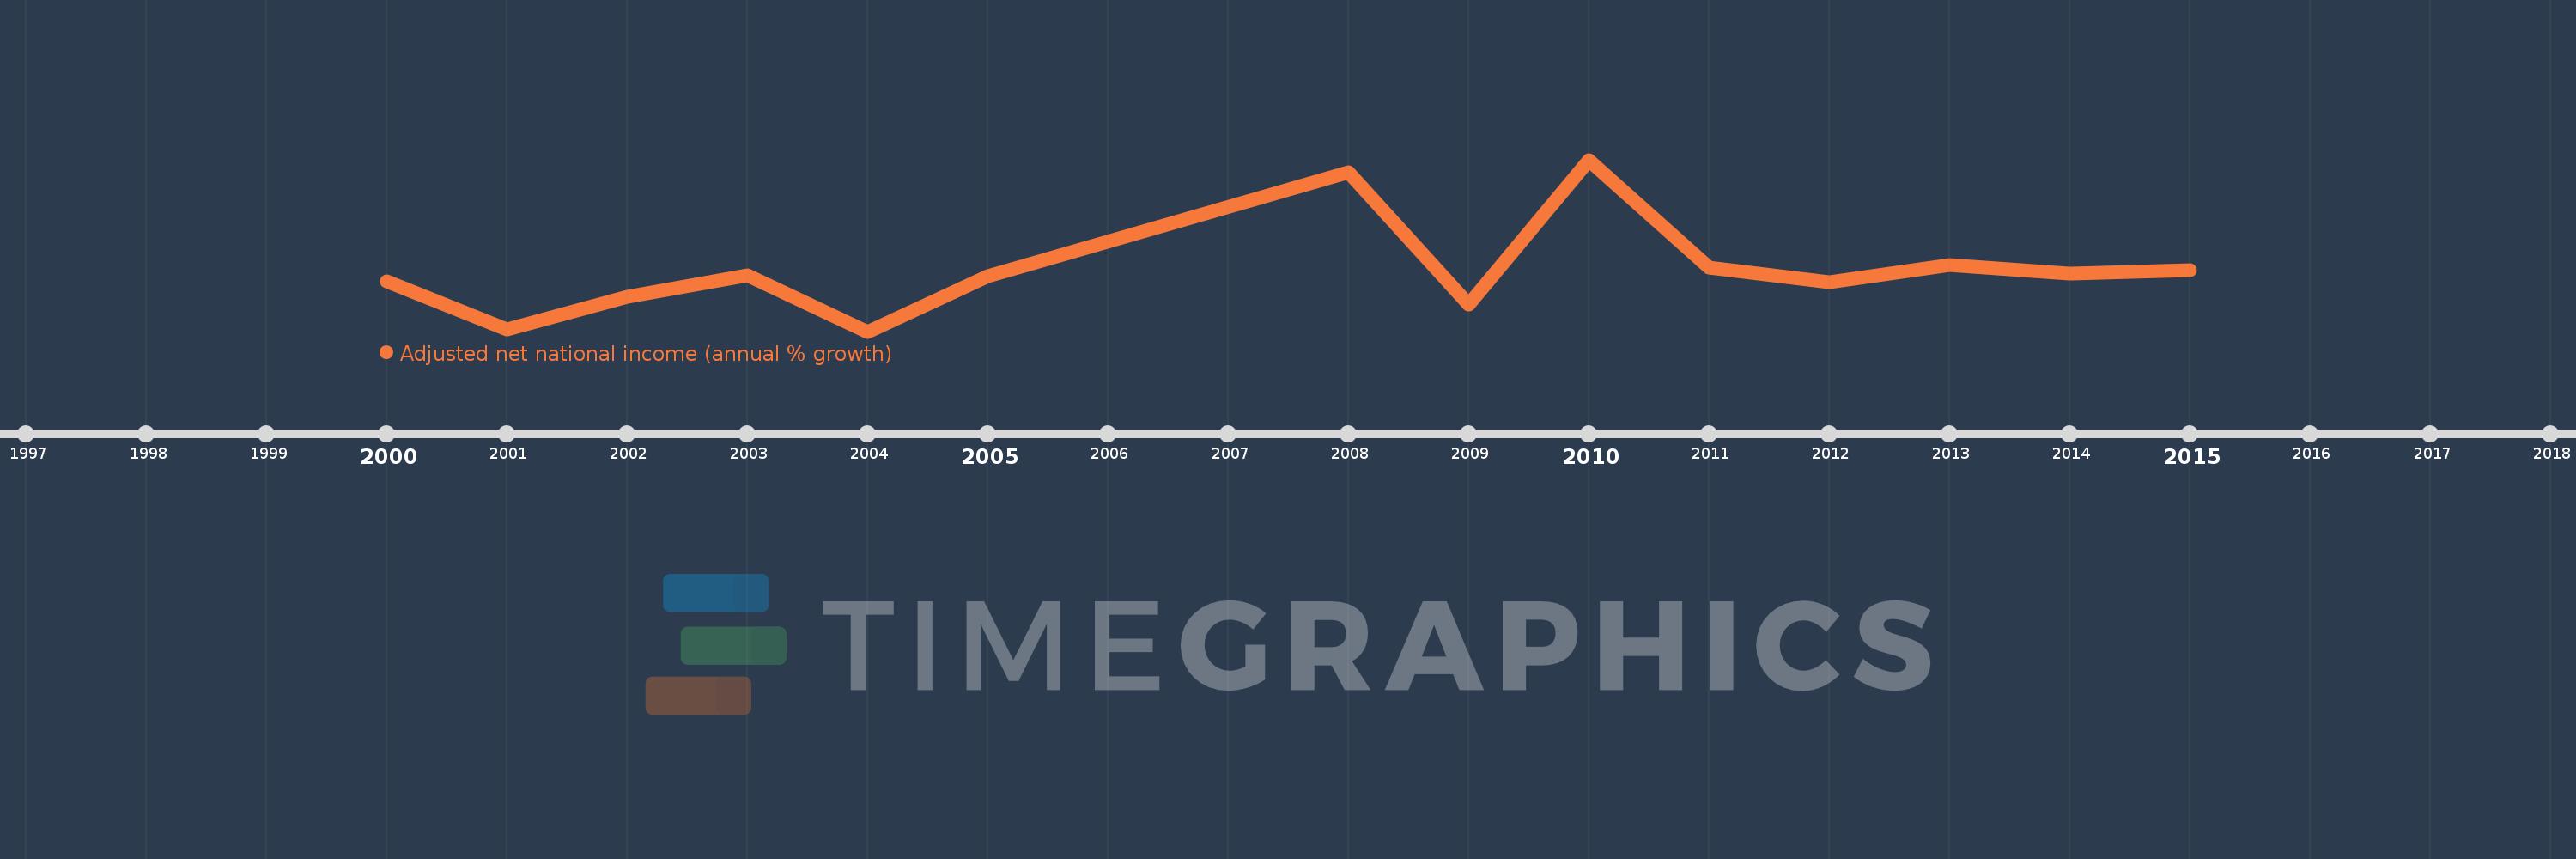
This timeline shows a graph from 2000 to 2015 of Uzbekistan. No data until 1999. Number of actual observations by date: 14.
Source name:
World Development Indicators
Source organization:
World Bank staff estimates based on sources and methods in World Bank's "The Changing Wealth of Nations: Measuring Sustainable Development in the New Millennium" (2011).
Categories, topics:
Economy & Growth
Last updated:
apr 23, 2017
Indicators value changes by year
Meaning:
14.529
Minimum:
-27.97
jan 1, 2004
Maximum:
91.264
jan 1, 2010
At the date of observation
Value
Absolute change
Change from the previous value
jan 1, 2000
6.656
+6.656
0.0%
jan 1, 2001
-26.245
-32.901
-494.33%
jan 1, 2002
-3.659
+22.587
-86.06%
jan 1, 2003
11.246
+14.905
-407.39%
jan 1, 2004
-27.97
-39.216
-348.7%
jan 1, 2005
10.519
+38.488
-137.61%
jan 1, 2008
82.635
+72.116
685.61%
jan 1, 2009
-9.136
-91.77
-111.06%
jan 1, 2010
91.264
+100.4
-1.1K%
jan 1, 2011
16.579
-74.686
-81.83%
jan 1, 2012
6.329
-10.25
-61.82%
jan 1, 2013
18.26
+11.931
188.51%
jan 1, 2014
12.019
-6.24
-34.18%
jan 1, 2015
14.91
+2.891
24.05%
Ranking of countries by current statistics by years
