29
/
en
AIzaSyAYiBZKx7MnpbEhh9jyipgxe19OcubqV5w
April 1, 2024
267577
Tunisia
TUN
true
2
1
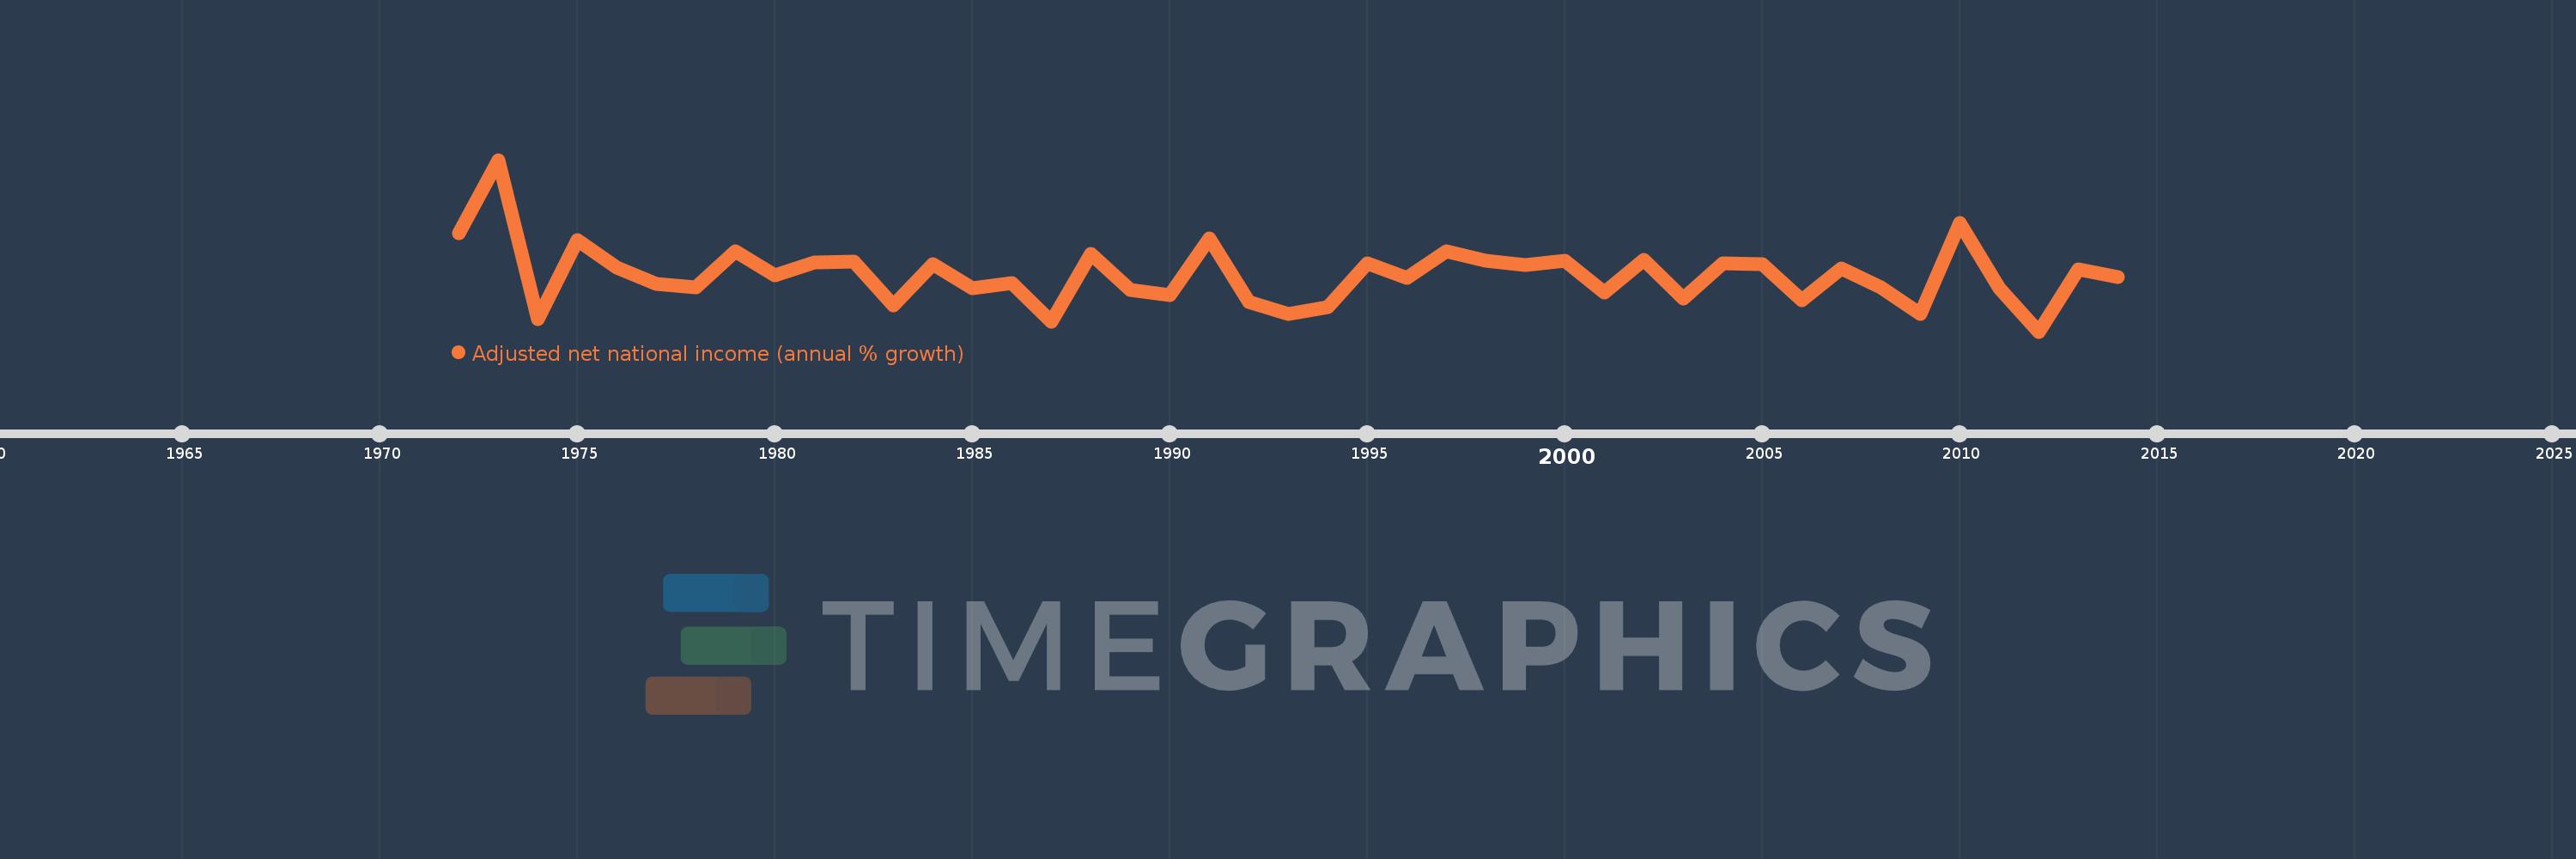
Adjusted net national income (annual % growth)
2014,2013,2012,2011,2010,2009,2008,2007,2006,2005,2004,2003,2002,2001,2000,1999,1998,1997,1996,1995,1994,1993,1992,1991,1990,1989,1988,1987,1986,1985,1984,1983,1982,1981,1980,1979,1978,1977,1976,1975,1974,1973,1972
This statistics in other country:
Timeline:
This timeline shows a graph from 1972 to 2014 of Tunisia. No data until 1971. Number of actual observations by date: 43.
Source name:
World Development Indicators
Source organization:
World Bank staff estimates based on sources and methods in World Bank's "The Changing Wealth of Nations: Measuring Sustainable Development in the New Millennium" (2011).
Categories, topics:
Economy & Growth
Last updated:
apr 23, 2017
Indicators value changes by year
Minimum:
-3.187
jan 1, 2012
Maximum:
19.563
jan 1, 1973
At the date of observation
Value
Absolute change
Change from previous value
jan 1, 1972
9.82
+9.82
0.0%
jan 1, 1973
19.563
+9.743
99.21%
jan 1, 1974
-1.569
-21.132
-108.02%
jan 1, 1975
8.893
+10.462
-666.86%
jan 1, 1976
5.304
-3.589
-40.36%
jan 1, 1977
3.133
-2.171
-40.94%
jan 1, 1978
2.7
-0.433
-13.82%
jan 1, 1979
7.424
+4.725
175.0%
jan 1, 1980
4.227
-3.198
-43.07%
jan 1, 1981
5.964
+1.737
41.11%
jan 1, 1982
6.129
+0.165
2.77%
jan 1, 1983
0.265
-5.864
-95.68%
jan 1, 1984
5.791
+5.526
2.09K%
jan 1, 1985
2.596
-3.195
-55.18%
jan 1, 1986
3.237
+0.642
24.73%
jan 1, 1987
-1.835
-5.073
-156.68%
jan 1, 1988
7.115
+8.95
-487.71%
jan 1, 1989
2.324
-4.791
-67.33%
jan 1, 1990
1.656
-0.668
-28.75%
jan 1, 1991
9.102
+7.446
449.62%
jan 1, 1992
0.689
-8.412
-92.43%
jan 1, 1993
-0.91
-1.599
-232.01%
jan 1, 1994
0.064
+0.974
-107.05%
jan 1, 1995
5.81
+5.746
8.96K%
jan 1, 1996
3.95
-1.86
-32.02%
jan 1, 1997
7.439
+3.49
88.36%
jan 1, 1998
6.197
-1.243
-16.7%
jan 1, 1999
5.628
-0.569
-9.18%
jan 1, 2000
6.203
+0.575
10.21%
jan 1, 2001
1.985
-4.218
-68.01%
jan 1, 2002
6.326
+4.342
218.78%
jan 1, 2003
1.183
-5.143
-81.3%
jan 1, 2004
5.876
+4.692
396.57%
jan 1, 2005
5.698
-0.177
-3.01%
jan 1, 2006
0.993
-4.705
-82.57%
jan 1, 2007
5.192
+4.199
422.88%
jan 1, 2008
2.721
-2.472
-47.6%
jan 1, 2009
-0.866
-3.586
-131.82%
jan 1, 2010
11.209
+12.075
-1.39K%
jan 1, 2011
2.558
-8.651
-77.18%
jan 1, 2012
-3.187
-5.745
-224.57%
jan 1, 2013
5.081
+8.268
-259.45%
jan 1, 2014
4.07
-1.011
-19.9%
Ranking of countries by current statistics by years


Comments: