29
/
en
AIzaSyAYiBZKx7MnpbEhh9jyipgxe19OcubqV5w
April 1, 2024
184762
Madagascar
MDG
true
2
1
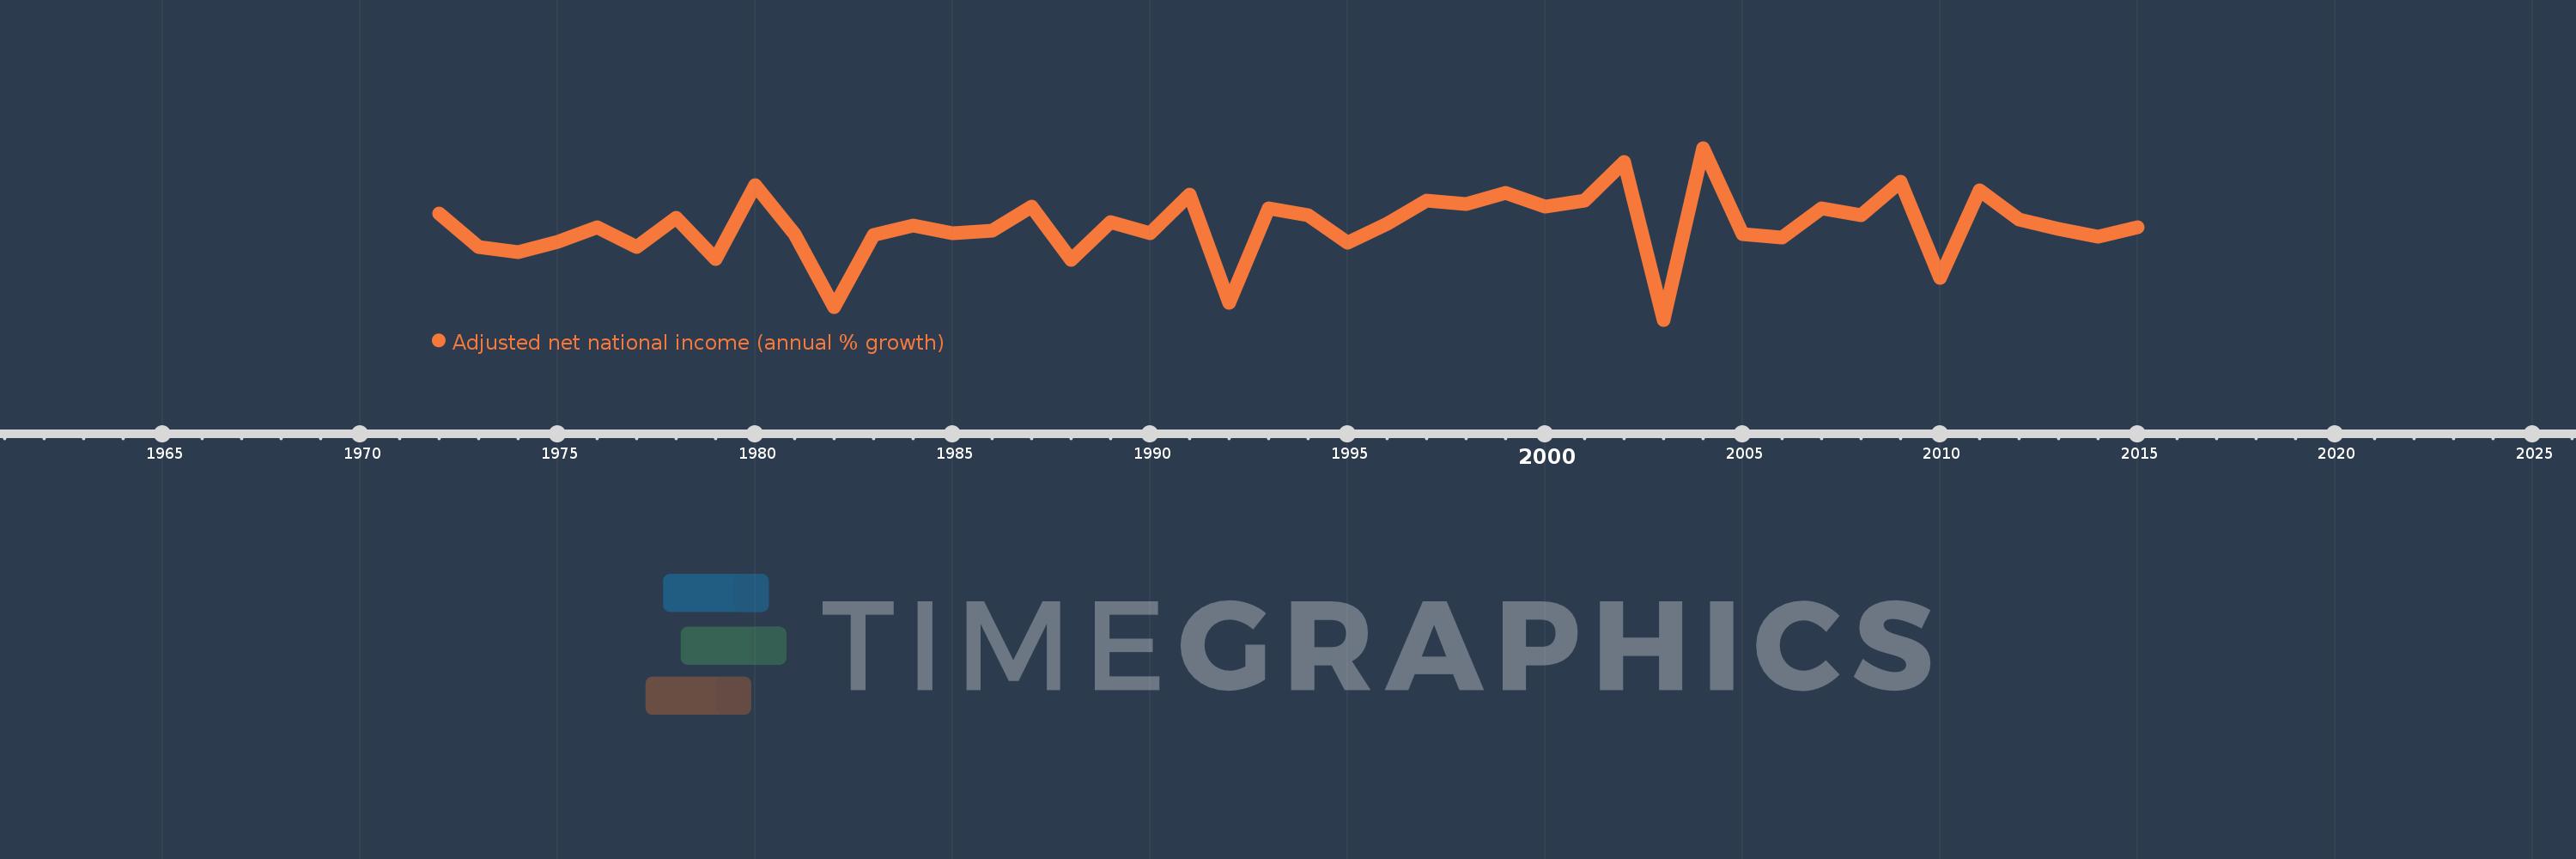
Adjusted net national income (annual % growth)
2015,2014,2013,2012,2011,2010,2009,2008,2007,2006,2005,2004,2003,2002,2001,2000,1999,1998,1997,1996,1995,1994,1993,1992,1991,1990,1989,1988,1987,1986,1985,1984,1983,1982,1981,1980,1979,1978,1977,1976,1975,1974,1973,1972
This statistics in other country:
Timeline:
This timeline shows a graph from 1972 to 2015 of Madagascar. No data until 1971. Number of actual observations by date: 44.
Source name:
World Development Indicators
Source organization:
World Bank staff estimates based on sources and methods in World Bank's "The Changing Wealth of Nations: Measuring Sustainable Development in the New Millennium" (2011).
Categories, topics:
Economy & Growth
Last updated:
apr 23, 2017
Indicators value changes by year
Minimum:
-14.455
jan 1, 2003
Maximum:
14.017
jan 1, 2004
At the date of observation
Value
Absolute change
Change from previous value
jan 1, 1972
3.133
+3.133
0.0%
jan 1, 1973
-2.442
-5.574
-177.94%
jan 1, 1974
-3.282
-0.84
34.41%
jan 1, 1975
-1.534
+1.748
-53.27%
jan 1, 1976
0.901
+2.435
-158.77%
jan 1, 1977
-2.441
-3.343
-370.86%
jan 1, 1978
2.5
+4.941
-202.4%
jan 1, 1979
-4.417
-6.917
-276.68%
jan 1, 1980
7.911
+12.328
-279.11%
jan 1, 1981
-0.273
-8.184
-103.45%
jan 1, 1982
-12.337
-12.065
4.42K%
jan 1, 1983
-0.406
+11.931
-96.71%
jan 1, 1984
1.158
+1.564
-385.37%
jan 1, 1985
-0.177
-1.335
-115.25%
jan 1, 1986
0.239
+0.415
-235.05%
jan 1, 1987
4.28
+4.042
1.69K%
jan 1, 1988
-4.492
-8.773
-204.95%
jan 1, 1989
1.715
+6.207
-138.17%
jan 1, 1990
-0.177
-1.892
-110.35%
jan 1, 1991
6.338
+6.516
-3.67K%
jan 1, 1992
-11.679
-18.017
-284.27%
jan 1, 1993
3.978
+15.657
-134.06%
jan 1, 1994
2.892
-1.087
-27.31%
jan 1, 1995
-1.629
-4.521
-156.35%
jan 1, 1996
1.507
+3.137
-192.52%
jan 1, 1997
5.299
+3.792
251.53%
jan 1, 1998
4.778
-0.521
-9.84%
jan 1, 1999
6.642
+1.864
39.01%
jan 1, 2000
4.32
-2.322
-34.96%
jan 1, 2001
5.353
+1.033
23.92%
jan 1, 2002
11.76
+6.407
119.69%
jan 1, 2003
-14.455
-26.215
-222.92%
jan 1, 2004
14.017
+28.472
-196.97%
jan 1, 2005
-0.269
-14.286
-101.92%
jan 1, 2006
-0.784
-0.515
191.57%
jan 1, 2007
3.962
+4.747
-605.23%
jan 1, 2008
2.882
-1.08
-27.26%
jan 1, 2009
8.465
+5.583
193.72%
jan 1, 2010
-7.5
-15.965
-188.59%
jan 1, 2011
7.041
+14.54
-193.88%
jan 1, 2012
2.113
-4.928
-69.99%
jan 1, 2013
0.565
-1.548
-73.28%
jan 1, 2014
-0.721
-1.286
-227.73%
jan 1, 2015
0.897
+1.618
-224.47%
Ranking of countries by current statistics by years


Comments: