29
/
en
AIzaSyAYiBZKx7MnpbEhh9jyipgxe19OcubqV5w
April 1, 2024
50601
Middle income
MIC
false
2
1
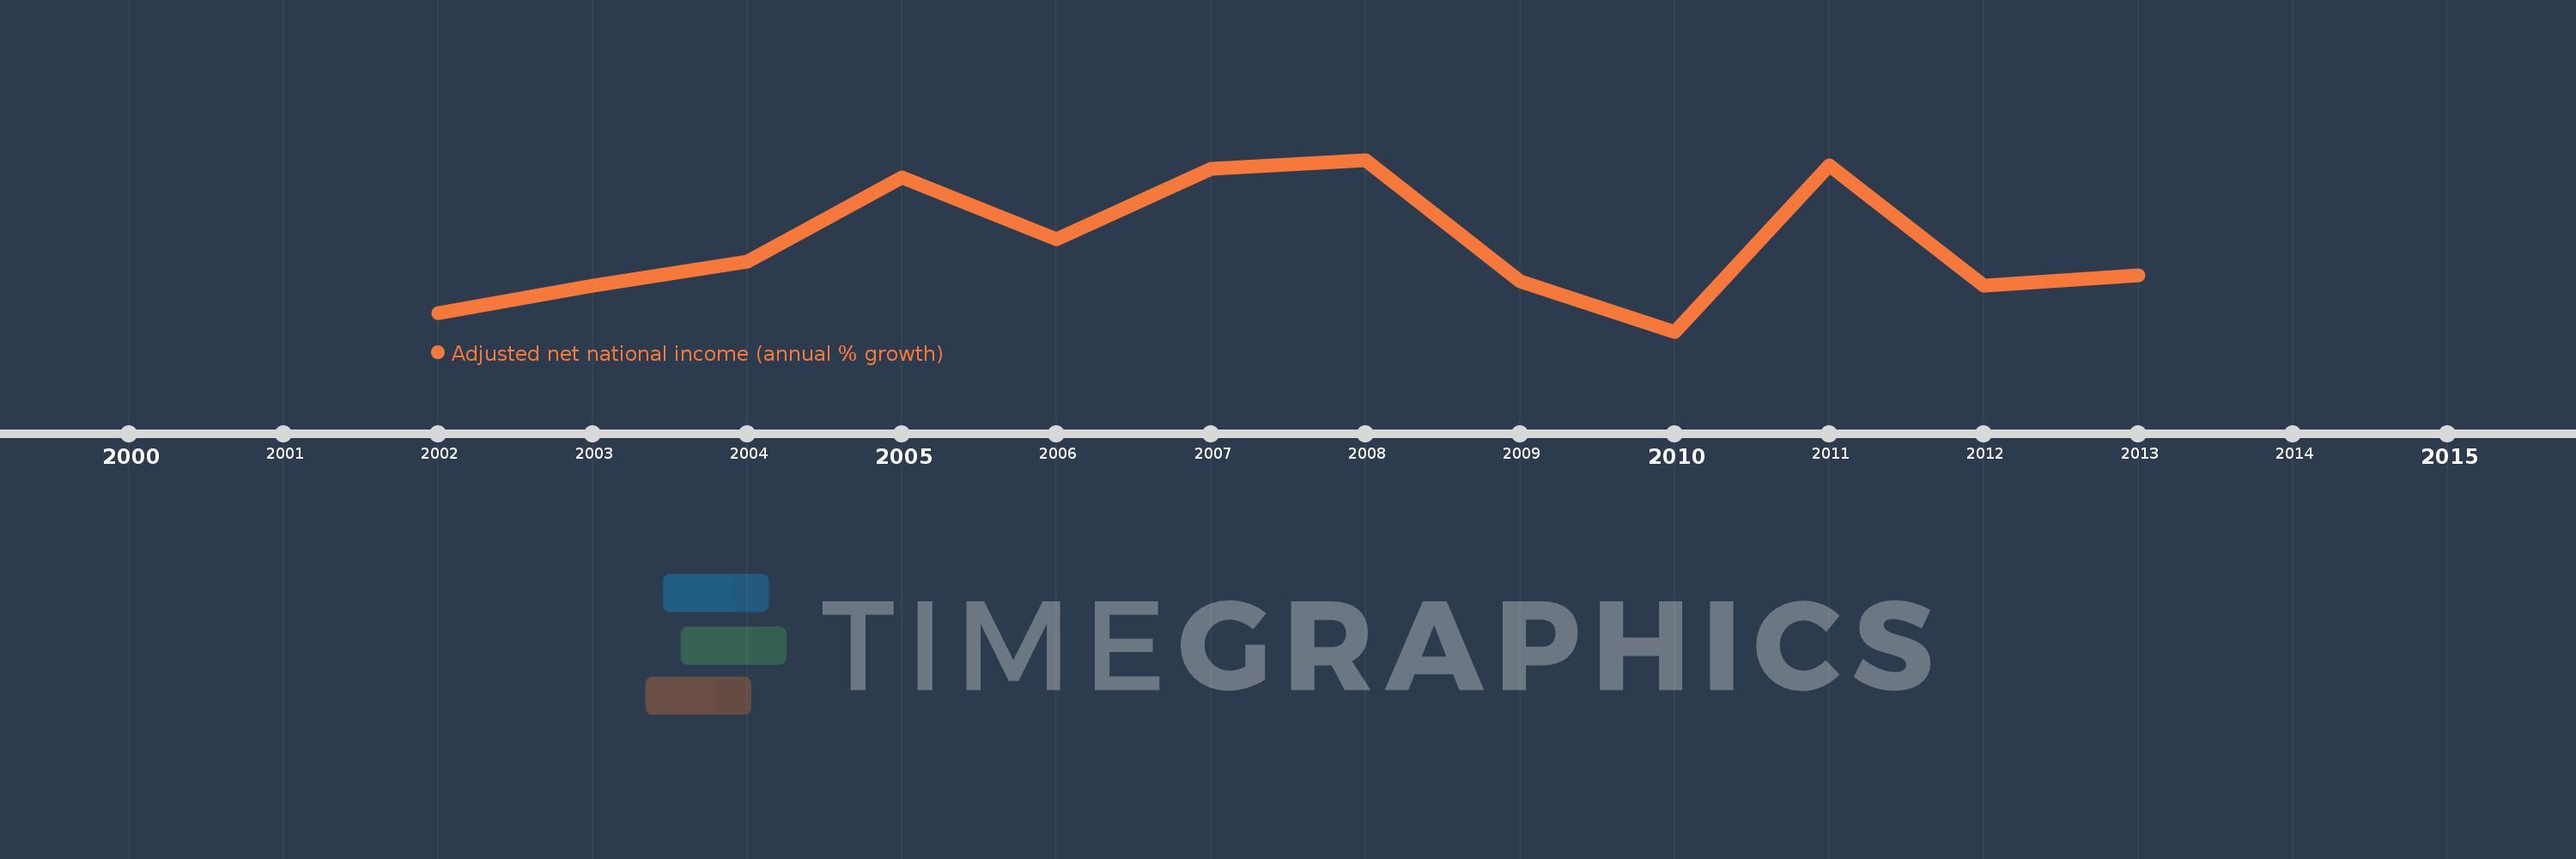
Adjusted net national income (annual % growth)
2013,2012,2011,2010,2009,2008,2007,2006,2005,2004,2003,2002
This statistics in other country:
Timeline:
This timeline shows a graph from 2002 to 2013 of Middle income. No data until 2001. Number of actual observations by date: 12.
Source name:
World Development Indicators
Source organization:
World Bank staff estimates based on sources and methods in World Bank's "The Changing Wealth of Nations: Measuring Sustainable Development in the New Millennium" (2011).
Categories, topics:
Economy & Growth
Last updated:
apr 23, 2017
Indicators value changes by year
At the date of observation
Value
Absolute change
Change from previous value
jan 1, 2002
1.92
+1.92
0.0%
jan 1, 2003
3.147
+1.227
63.9%
jan 1, 2004
4.232
+1.085
34.48%
jan 1, 2005
8.006
+3.774
89.16%
jan 1, 2006
5.22
-2.786
-34.8%
jan 1, 2007
8.407
+3.187
61.05%
jan 1, 2008
8.795
+0.387
4.61%
jan 1, 2009
3.352
-5.442
-61.88%
jan 1, 2010
1.089
-2.263
-67.52%
jan 1, 2011
8.548
+7.459
685.04%
jan 1, 2012
3.168
-5.379
-62.93%
jan 1, 2013
3.615
+0.447
14.11%
Ranking of countries by current statistics by years


Comments: