29
/
en
AIzaSyAYiBZKx7MnpbEhh9jyipgxe19OcubqV5w
April 1, 2024
192666
Mauritania
MRT
true
2
1
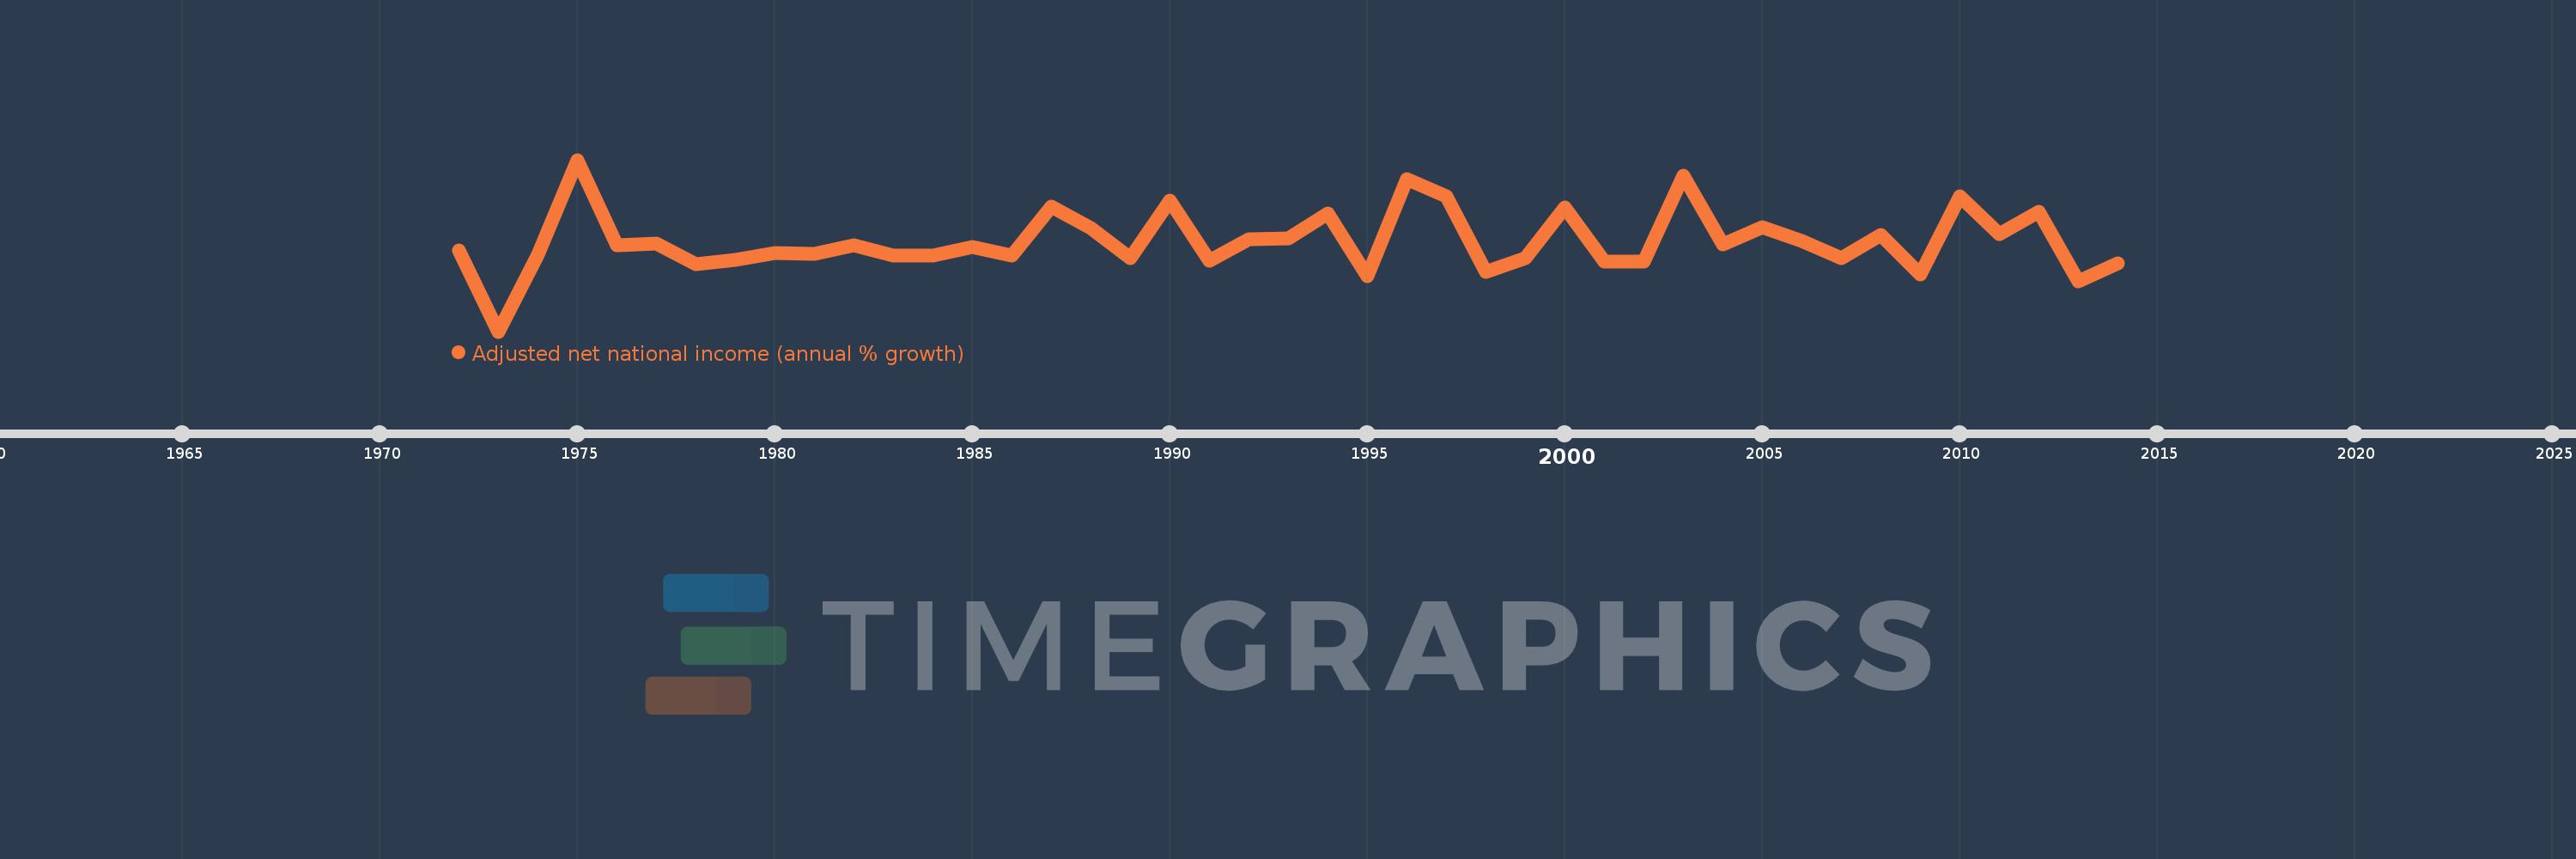
Adjusted net national income (annual % growth)
2014,2013,2012,2011,2010,2009,2008,2007,2006,2005,2004,2003,2002,2001,2000,1999,1998,1997,1996,1995,1994,1993,1992,1991,1990,1989,1988,1987,1986,1985,1984,1983,1982,1981,1980,1979,1978,1977,1976,1975,1974,1973,1972
This statistics in other country:
Timeline:
This timeline shows a graph from 1972 to 2014 of Mauritania. No data until 1971. Number of actual observations by date: 43.
Source name:
World Development Indicators
Source organization:
World Bank staff estimates based on sources and methods in World Bank's "The Changing Wealth of Nations: Measuring Sustainable Development in the New Millennium" (2011).
Categories, topics:
Economy & Growth
Last updated:
apr 23, 2017
Indicators value changes by year
Minimum:
-19.822
jan 1, 1973
Maximum:
22.941
jan 1, 1975
At the date of observation
Value
Absolute change
Change from previous value
jan 1, 1972
0.479
+0.479
0.0%
jan 1, 1973
-19.822
-20.301
-4.23K%
jan 1, 1974
-0.694
+19.128
-96.5%
jan 1, 1975
22.941
+23.634
-3.41K%
jan 1, 1976
1.643
-21.297
-92.84%
jan 1, 1977
2.081
+0.437
26.62%
jan 1, 1978
-2.973
-5.054
-242.86%
jan 1, 1979
-2.074
+0.899
-30.24%
jan 1, 1980
-0.208
+1.866
-89.96%
jan 1, 1981
-0.398
-0.19
91.32%
jan 1, 1982
1.631
+2.029
-509.39%
jan 1, 1983
-0.816
-2.447
-150.04%
jan 1, 1984
-0.812
+0.004
-0.48%
jan 1, 1985
1.222
+2.034
-250.53%
jan 1, 1986
-0.99
-2.212
-180.95%
jan 1, 1987
11.255
+12.245
-1.24K%
jan 1, 1988
5.901
-5.354
-47.57%
jan 1, 1989
-1.59
-7.491
-126.94%
jan 1, 1990
12.698
+14.288
-898.86%
jan 1, 1991
-2.236
-14.934
-117.61%
jan 1, 1992
3.069
+5.305
-237.26%
jan 1, 1993
3.475
+0.406
13.24%
jan 1, 1994
9.583
+6.108
175.78%
jan 1, 1995
-5.964
-15.547
-162.23%
jan 1, 1996
18.053
+24.017
-402.7%
jan 1, 1997
13.858
-4.195
-23.23%
jan 1, 1998
-5.032
-18.89
-136.31%
jan 1, 1999
-1.501
+3.532
-70.18%
jan 1, 2000
11.0
+12.5
-833.05%
jan 1, 2001
-2.397
-13.397
-121.79%
jan 1, 2002
-2.308
+0.089
-3.72%
jan 1, 2003
19.038
+21.346
-924.85%
jan 1, 2004
1.957
-17.082
-89.72%
jan 1, 2005
6.148
+4.192
214.23%
jan 1, 2006
2.696
-3.453
-56.16%
jan 1, 2007
-1.46
-4.156
-154.17%
jan 1, 2008
4.287
+5.747
-393.58%
jan 1, 2009
-5.605
-9.893
-230.75%
jan 1, 2010
13.785
+19.39
-345.92%
jan 1, 2011
4.447
-9.338
-67.74%
jan 1, 2012
9.993
+5.546
124.74%
jan 1, 2013
-7.351
-17.344
-173.56%
jan 1, 2014
-2.863
+4.488
-61.05%
Ranking of countries by current statistics by years


Comments: