29
/
en
AIzaSyAYiBZKx7MnpbEhh9jyipgxe19OcubqV5w
April 1, 2024
277283
Uruguay
URY
true
2
1
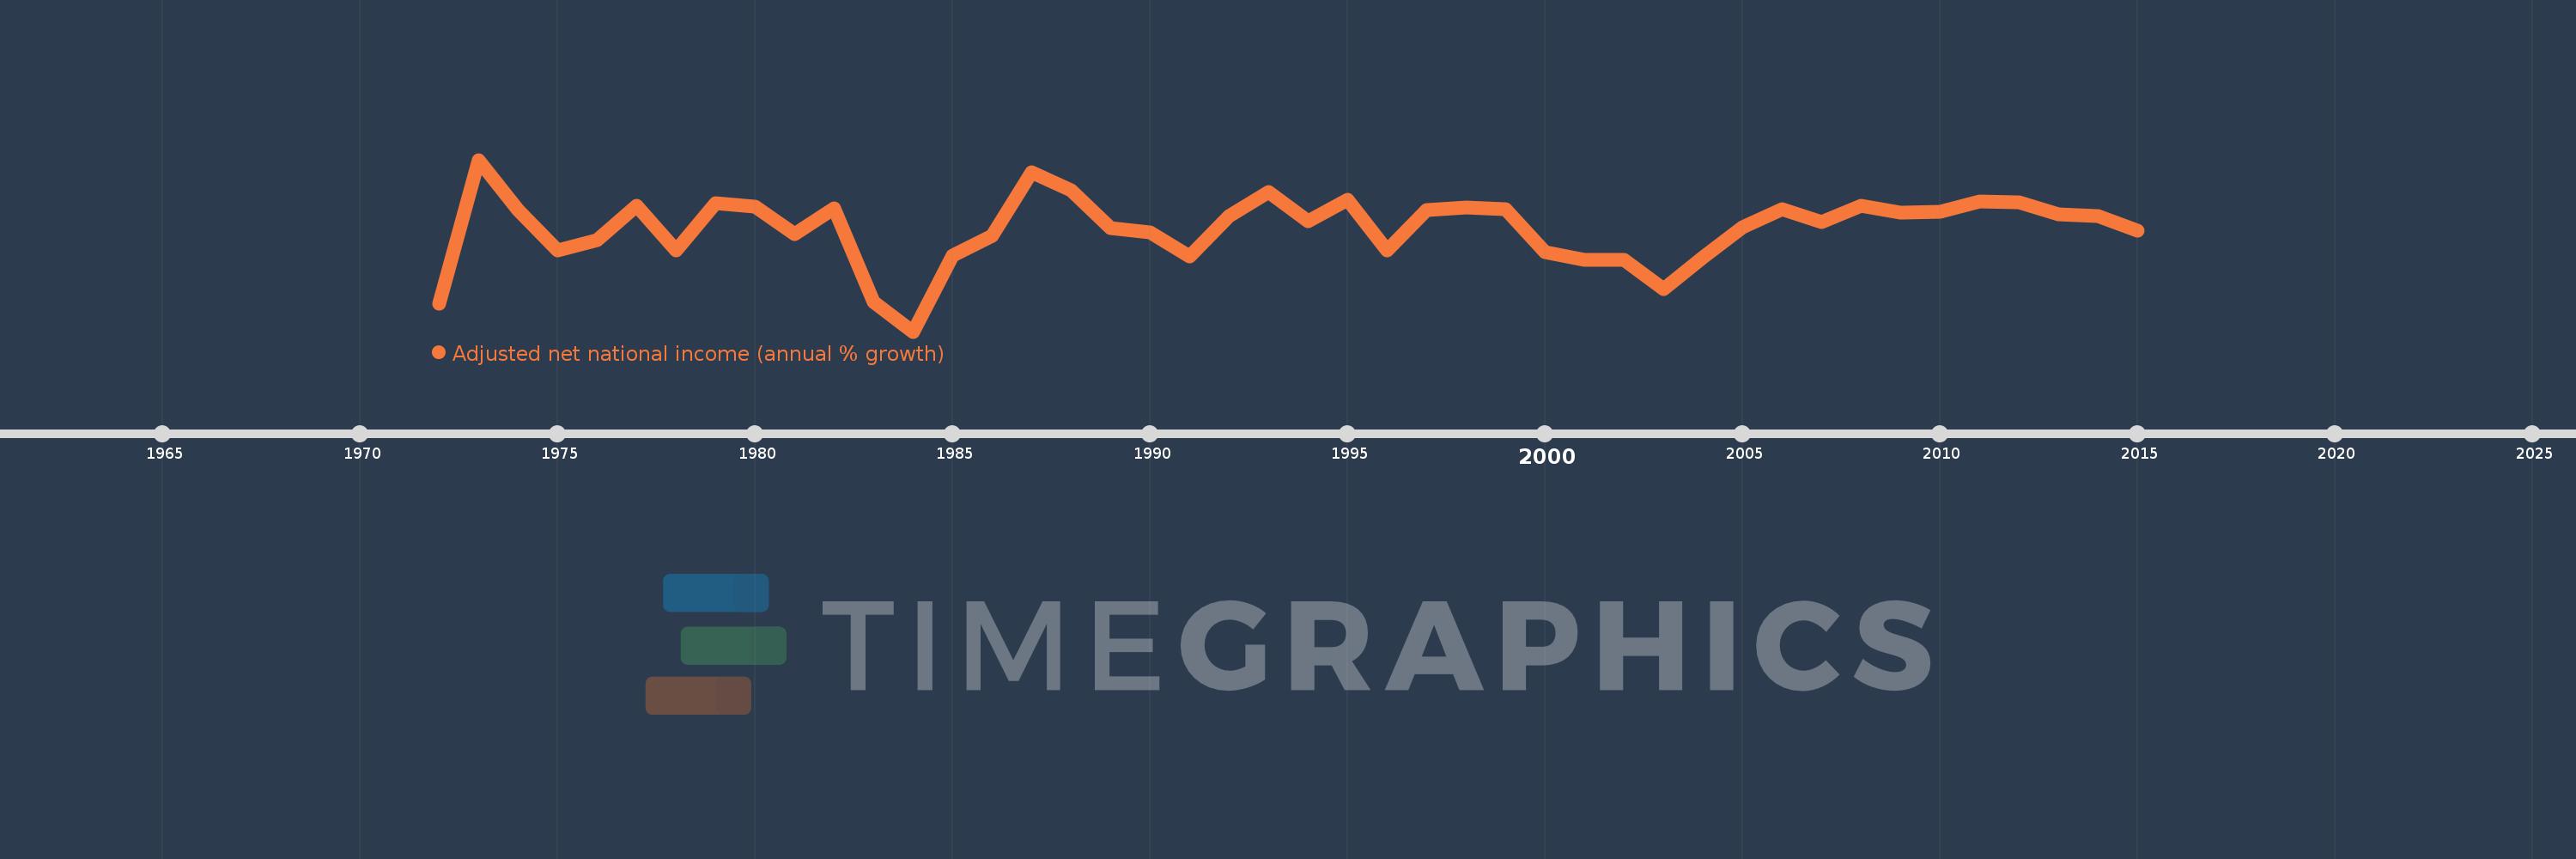
Adjusted net national income (annual % growth)
2015,2014,2013,2012,2011,2010,2009,2008,2007,2006,2005,2004,2003,2002,2001,2000,1999,1998,1997,1996,1995,1994,1993,1992,1991,1990,1989,1988,1987,1986,1985,1984,1983,1982,1981,1980,1979,1978,1977,1976,1975,1974,1973,1972
This statistics in other country:
Timeline:
This timeline shows a graph from 1972 to 2015 of Uruguay. No data until 1971. Number of actual observations by date: 44.
Source name:
World Development Indicators
Source organization:
World Bank staff estimates based on sources and methods in World Bank's "The Changing Wealth of Nations: Measuring Sustainable Development in the New Millennium" (2011).
Categories, topics:
Economy & Growth
Last updated:
apr 23, 2017
Indicators value changes by year
Minimum:
-15.87
jan 1, 1984
Maximum:
15.218
jan 1, 1973
At the date of observation
Value
Absolute change
Change from previous value
jan 1, 1972
-10.806
-10.806
0.0%
jan 1, 1973
15.218
+26.025
-240.83%
jan 1, 1974
6.184
-9.034
-59.36%
jan 1, 1975
-1.218
-7.402
-119.7%
jan 1, 1976
0.635
+1.853
-152.15%
jan 1, 1977
6.937
+6.302
992.06%
jan 1, 1978
-1.117
-8.055
-116.1%
jan 1, 1979
7.367
+8.484
-759.38%
jan 1, 1980
6.695
-0.672
-9.12%
jan 1, 1981
1.732
-4.963
-74.13%
jan 1, 1982
6.507
+4.775
275.7%
jan 1, 1983
-10.582
-17.088
-262.64%
jan 1, 1984
-15.87
-5.288
49.97%
jan 1, 1985
-2.167
+13.703
-86.35%
jan 1, 1986
1.477
+3.644
-168.15%
jan 1, 1987
12.941
+11.465
776.34%
jan 1, 1988
9.751
-3.19
-24.65%
jan 1, 1989
2.866
-6.886
-70.61%
jan 1, 1990
2.126
-0.739
-25.8%
jan 1, 1991
-2.311
-4.437
-208.68%
jan 1, 1992
5.017
+7.328
-317.11%
jan 1, 1993
9.324
+4.307
85.84%
jan 1, 1994
4.03
-5.294
-56.78%
jan 1, 1995
7.996
+3.965
98.39%
jan 1, 1996
-1.228
-9.224
-115.36%
jan 1, 1997
6.076
+7.304
-594.74%
jan 1, 1998
6.63
+0.554
9.12%
jan 1, 1999
6.255
-0.375
-5.66%
jan 1, 2000
-1.503
-7.757
-124.02%
jan 1, 2001
-2.85
-1.348
89.69%
jan 1, 2002
-2.908
-0.058
2.03%
jan 1, 2003
-8.191
-5.283
181.68%
jan 1, 2004
-2.492
+5.699
-69.57%
jan 1, 2005
3.005
+5.497
-220.59%
jan 1, 2006
6.284
+3.279
109.1%
jan 1, 2007
3.889
-2.395
-38.12%
jan 1, 2008
6.851
+2.962
76.17%
jan 1, 2009
5.73
-1.121
-16.36%
jan 1, 2010
5.821
+0.091
1.59%
jan 1, 2011
7.659
+1.838
31.58%
jan 1, 2012
7.545
-0.113
-1.48%
jan 1, 2013
5.372
-2.174
-28.81%
jan 1, 2014
5.041
-0.331
-6.16%
jan 1, 2015
2.323
-2.717
-53.91%
Ranking of countries by current statistics by years


Comments: