29
/
en
AIzaSyAYiBZKx7MnpbEhh9jyipgxe19OcubqV5w
April 1, 2024
108195
Comoros
COM
true
2
1
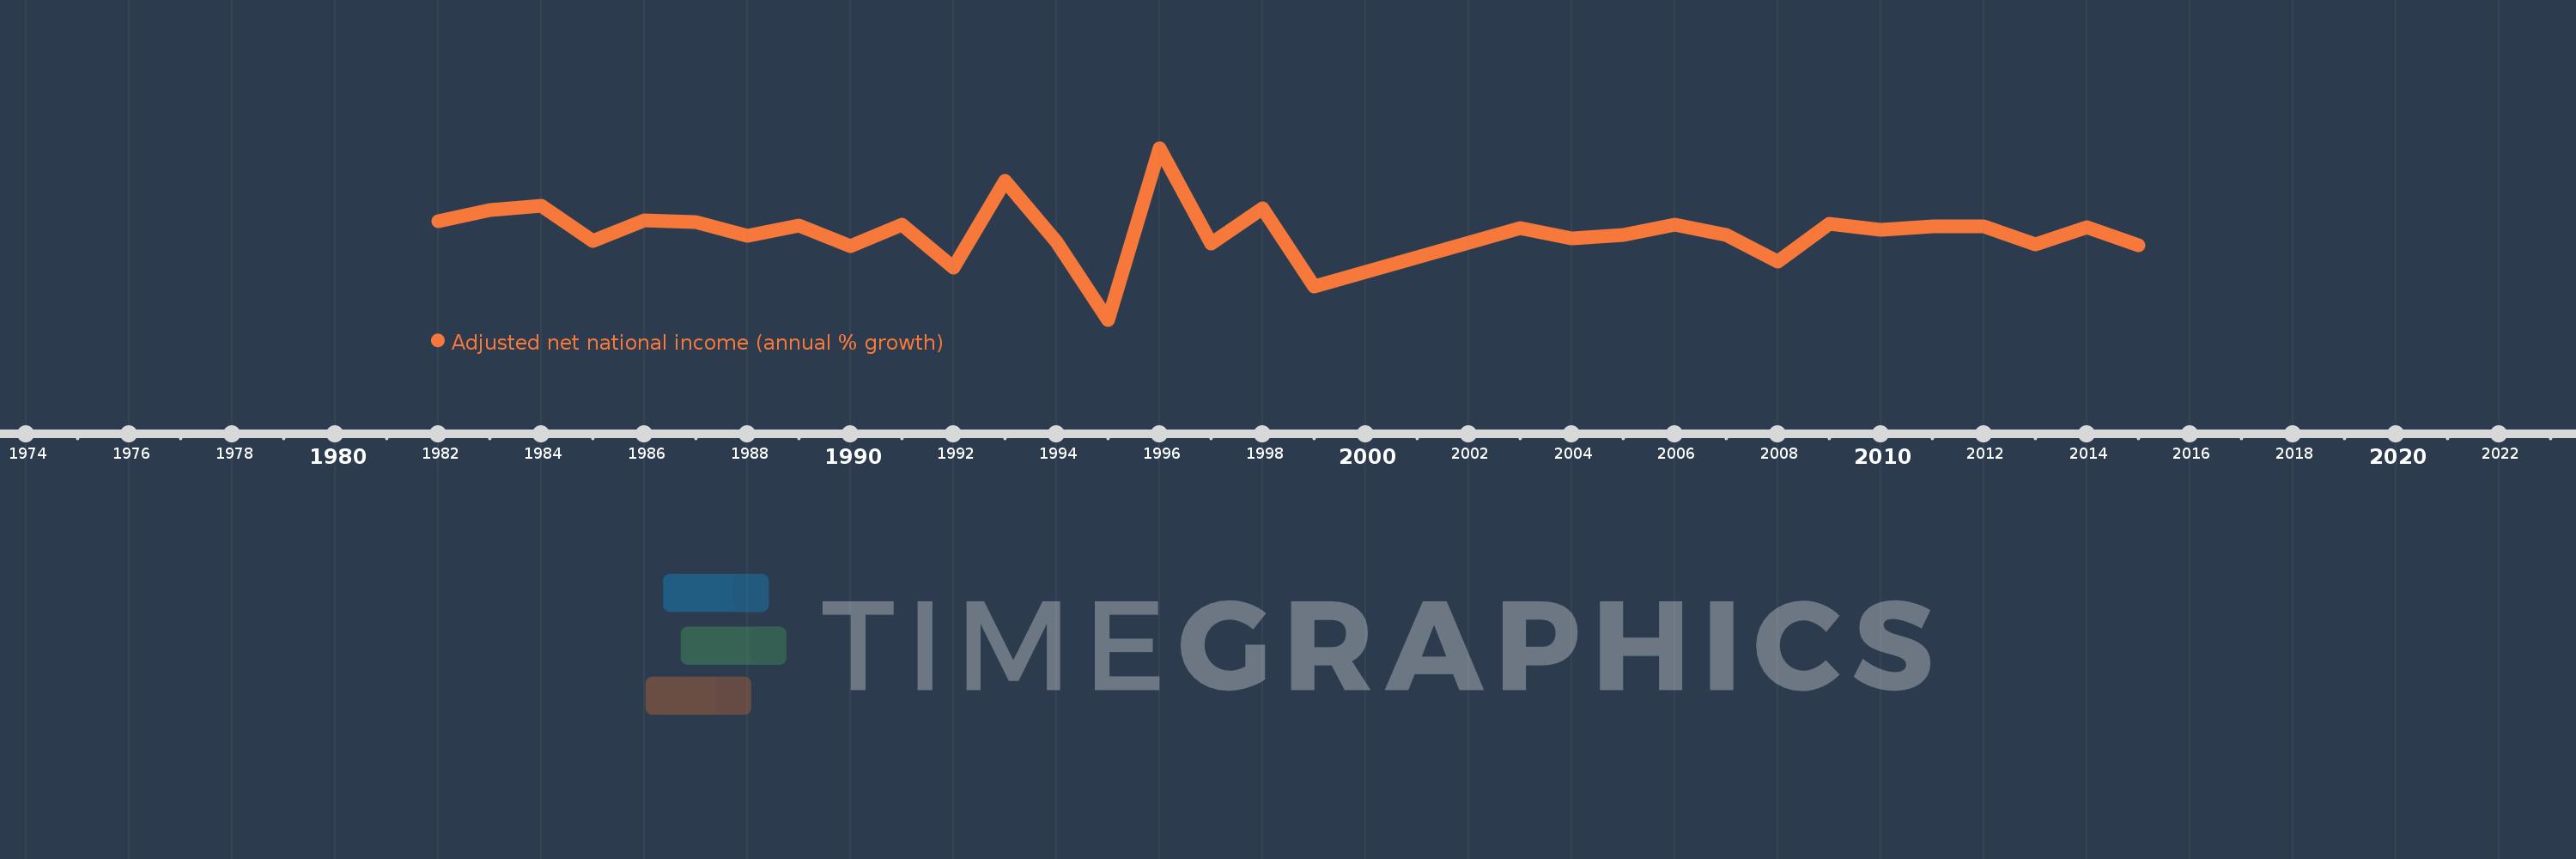
Adjusted net national income (annual % growth)
2015,2014,2013,2012,2011,2010,2009,2008,2007,2006,2005,2004,2003,1999,1998,1997,1996,1995,1994,1993,1992,1991,1990,1989,1988,1987,1986,1985,1984,1983,1982
This statistics in other country:
Timeline:
This timeline shows a graph from 1982 to 2015 of Comoros. No data until 1981. Number of actual observations by date: 31.
Source name:
World Development Indicators
Source organization:
World Bank staff estimates based on sources and methods in World Bank's "The Changing Wealth of Nations: Measuring Sustainable Development in the New Millennium" (2011).
Categories, topics:
Economy & Growth
Last updated:
apr 23, 2017
Indicators value changes by year
Minimum:
-16.889
jan 1, 1995
Maximum:
19.026
jan 1, 1996
At the date of observation
Value
Absolute change
Change from previous value
jan 1, 1982
3.625
+3.625
0.0%
jan 1, 1983
6.06
+2.435
67.18%
jan 1, 1984
6.986
+0.926
15.28%
jan 1, 1985
-0.413
-7.399
-105.92%
jan 1, 1986
3.932
+4.346
-1.05K%
jan 1, 1987
3.575
-0.358
-9.1%
jan 1, 1988
0.602
-2.973
-83.15%
jan 1, 1989
2.826
+2.224
369.27%
jan 1, 1990
-1.425
-4.251
-150.43%
jan 1, 1991
2.923
+4.348
-305.11%
jan 1, 1992
-5.942
-8.865
-303.28%
jan 1, 1993
12.091
+18.032
-303.48%
jan 1, 1994
-0.654
-12.745
-105.41%
jan 1, 1995
-16.889
-16.235
2.48K%
jan 1, 1996
19.026
+35.915
-212.65%
jan 1, 1997
-1.004
-20.03
-105.28%
jan 1, 1998
6.332
+7.336
-730.76%
jan 1, 1999
-10.023
-16.355
-258.28%
jan 1, 2003
2.331
+12.354
-123.26%
jan 1, 2004
0.105
-2.226
-95.49%
jan 1, 2005
0.817
+0.711
676.05%
jan 1, 2006
2.941
+2.124
260.07%
jan 1, 2007
0.895
-2.045
-69.55%
jan 1, 2008
-4.787
-5.682
-634.61%
jan 1, 2009
3.203
+7.99
-166.91%
jan 1, 2010
2.002
-1.2
-37.48%
jan 1, 2011
2.694
+0.692
34.56%
jan 1, 2012
2.667
-0.028
-1.02%
jan 1, 2013
-1.054
-3.721
-139.54%
jan 1, 2014
2.503
+3.557
-337.37%
jan 1, 2015
-1.408
-3.911
-156.24%
Ranking of countries by current statistics by years


Comments: