29
/
en
AIzaSyAYiBZKx7MnpbEhh9jyipgxe19OcubqV5w
April 1, 2024
230610
Rwanda
RWA
true
2
1
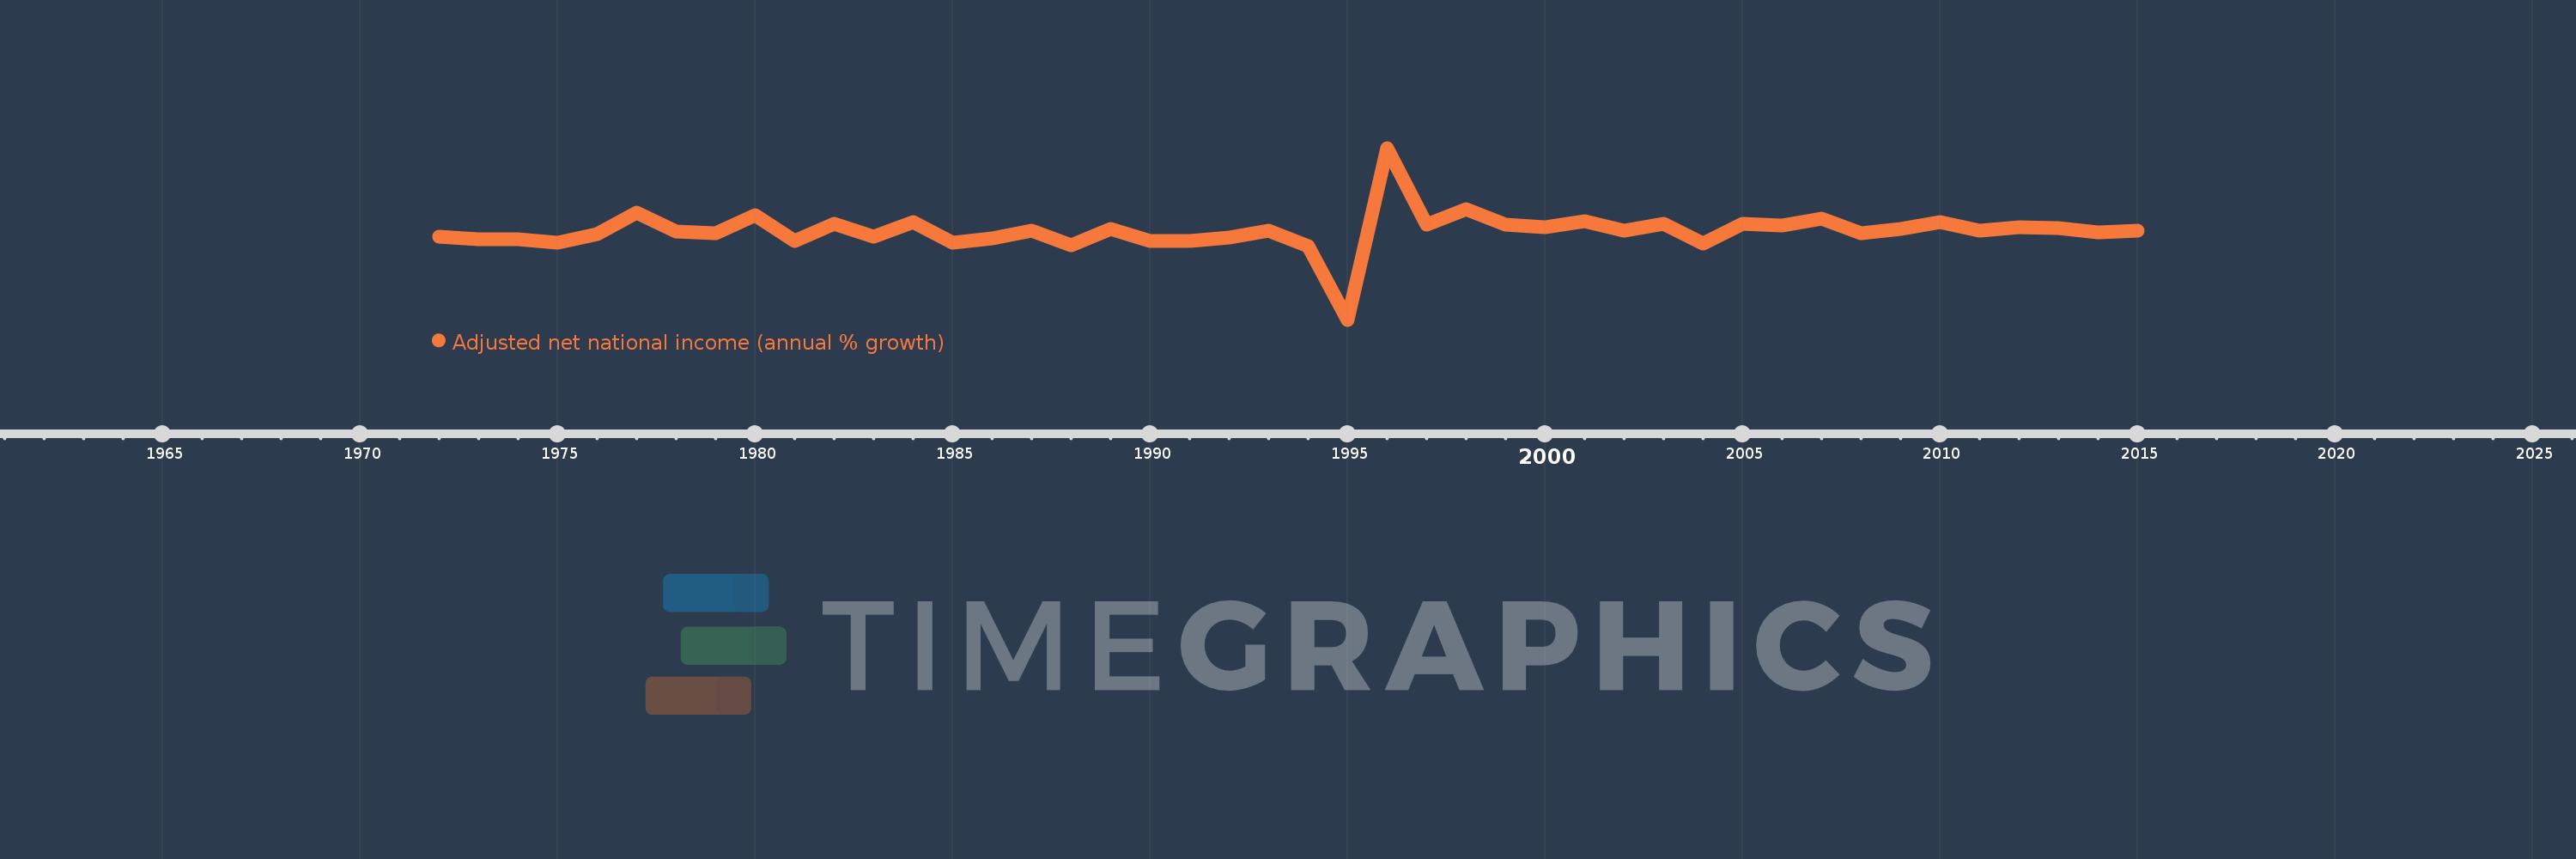
Adjusted net national income (annual % growth)
2015,2014,2013,2012,2011,2010,2009,2008,2007,2006,2005,2004,2003,2002,2001,2000,1999,1998,1997,1996,1995,1994,1993,1992,1991,1990,1989,1988,1987,1986,1985,1984,1983,1982,1981,1980,1979,1978,1977,1976,1975,1974,1973,1972
This statistics in other country:
Timeline:
This timeline shows a graph from 1972 to 2015 of Rwanda. No data until 1971. Number of actual observations by date: 44.
Source name:
World Development Indicators
Source organization:
World Bank staff estimates based on sources and methods in World Bank's "The Changing Wealth of Nations: Measuring Sustainable Development in the New Millennium" (2011).
Categories, topics:
Economy & Growth
Last updated:
apr 23, 2017
Indicators value changes by year
Minimum:
-65.481
jan 1, 1995
Maximum:
72.514
jan 1, 1996
At the date of observation
Value
Absolute change
Change from previous value
jan 1, 1972
1.013
+1.013
0.0%
jan 1, 1973
-0.709
-1.722
-169.95%
jan 1, 1974
-0.582
+0.126
-17.85%
jan 1, 1975
-3.845
-3.262
560.32%
jan 1, 1976
3.535
+7.38
-191.96%
jan 1, 1977
20.362
+16.827
475.97%
jan 1, 1978
5.331
-15.031
-73.82%
jan 1, 1979
3.898
-1.433
-26.88%
jan 1, 1980
18.774
+14.876
381.62%
jan 1, 1981
-1.965
-20.739
-110.46%
jan 1, 1982
11.42
+13.384
-681.27%
jan 1, 1983
1.033
-10.387
-90.96%
jan 1, 1984
12.728
+11.696
1.13K%
jan 1, 1985
-3.595
-16.323
-128.24%
jan 1, 1986
-0.137
+3.458
-96.19%
jan 1, 1987
6.136
+6.273
-4.58K%
jan 1, 1988
-5.94
-12.075
-196.8%
jan 1, 1989
7.693
+13.632
-229.51%
jan 1, 1990
-2.236
-9.929
-129.07%
jan 1, 1991
-2.215
+0.021
-0.93%
jan 1, 1992
0.231
+2.446
-110.42%
jan 1, 1993
5.756
+5.526
2.39K%
jan 1, 1994
-6.09
-11.847
-205.81%
jan 1, 1995
-65.481
-59.391
975.15%
jan 1, 1996
72.514
+137.996
-210.74%
jan 1, 1997
10.799
-61.715
-85.11%
jan 1, 1998
23.2
+12.401
114.83%
jan 1, 1999
10.664
-12.536
-54.04%
jan 1, 2000
8.534
-2.13
-19.97%
jan 1, 2001
13.435
+4.901
57.43%
jan 1, 2002
6.38
-7.055
-52.51%
jan 1, 2003
11.88
+5.5
86.21%
jan 1, 2004
-4.478
-16.358
-137.7%
jan 1, 2005
11.82
+16.298
-363.94%
jan 1, 2006
10.433
-1.387
-11.73%
jan 1, 2007
16.003
+5.57
53.39%
jan 1, 2008
4.111
-11.892
-74.31%
jan 1, 2009
7.117
+3.006
73.13%
jan 1, 2010
13.189
+6.072
85.32%
jan 1, 2011
6.029
-7.16
-54.29%
jan 1, 2012
9.014
+2.985
49.51%
jan 1, 2013
8.017
-0.997
-11.06%
jan 1, 2014
4.965
-3.052
-38.07%
jan 1, 2015
6.352
+1.386
27.92%
Ranking of countries by current statistics by years


Comments: