29
/
en
AIzaSyAYiBZKx7MnpbEhh9jyipgxe19OcubqV5w
April 1, 2024
111806
Costa Rica
CRI
true
2
1
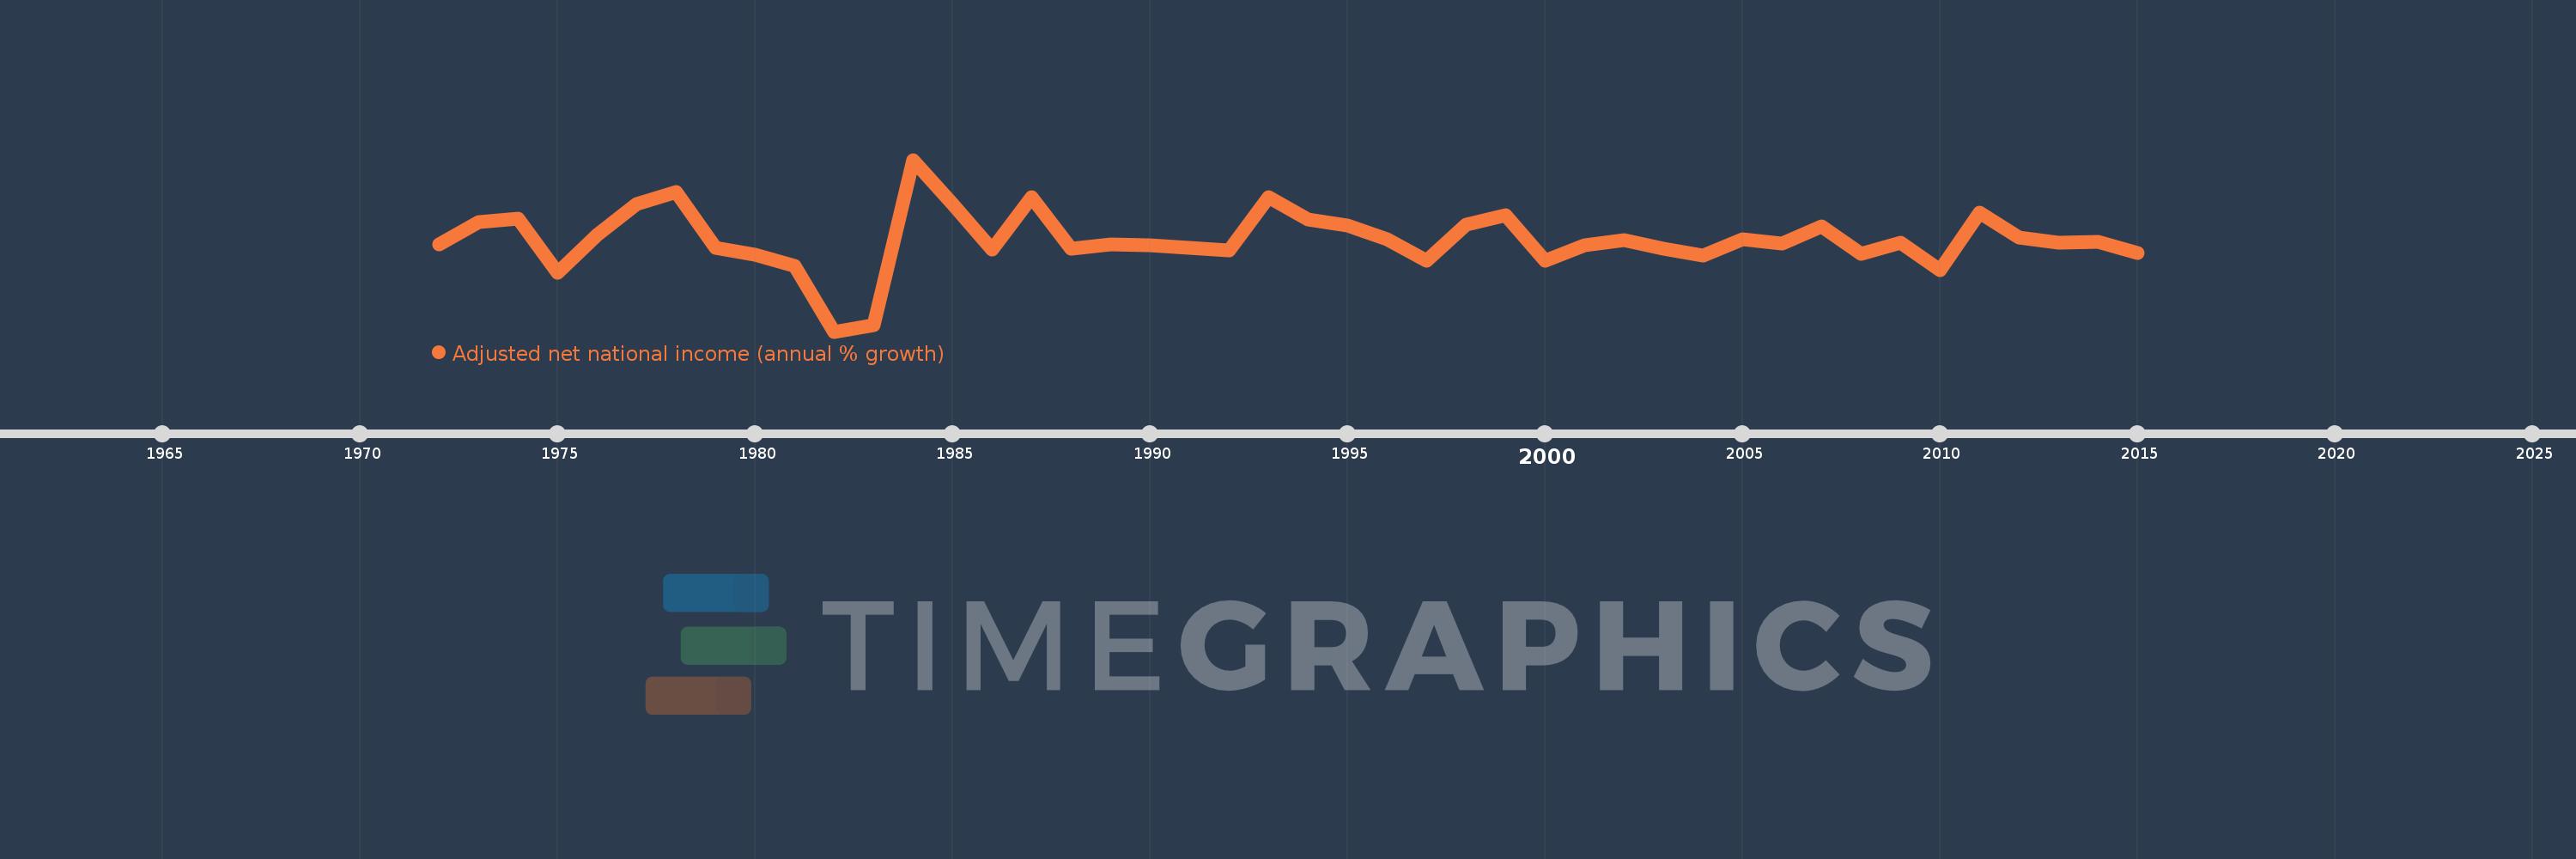
Adjusted net national income (annual % growth)
2015,2014,2013,2012,2011,2010,2009,2008,2007,2006,2005,2004,2003,2002,2001,2000,1999,1998,1997,1996,1995,1994,1993,1992,1991,1990,1989,1988,1987,1986,1985,1984,1983,1982,1981,1980,1979,1978,1977,1976,1975,1974,1973,1972
This statistics in other country:
Timeline:
This timeline shows a graph from 1972 to 2015 of Costa Rica. No data until 1971. Number of actual observations by date: 44.
Source name:
World Development Indicators
Source organization:
World Bank staff estimates based on sources and methods in World Bank's "The Changing Wealth of Nations: Measuring Sustainable Development in the New Millennium" (2011).
Categories, topics:
Economy & Growth
Last updated:
apr 23, 2017
Indicators value changes by year
Minimum:
-12.107
jan 1, 1982
Maximum:
18.949
jan 1, 1984
At the date of observation
Value
Absolute change
Change from previous value
jan 1, 1972
3.594
+3.594
0.0%
jan 1, 1973
7.673
+4.079
113.49%
jan 1, 1974
8.312
+0.639
8.32%
jan 1, 1975
-1.44
-9.752
-117.33%
jan 1, 1976
5.348
+6.789
-471.3%
jan 1, 1977
10.884
+5.535
103.49%
jan 1, 1978
13.16
+2.277
20.92%
jan 1, 1979
3.033
-10.128
-76.95%
jan 1, 1980
1.813
-1.219
-40.21%
jan 1, 1981
-0.283
-2.097
-115.61%
jan 1, 1982
-12.107
-11.824
4.18K%
jan 1, 1983
-10.894
+1.213
-10.02%
jan 1, 1984
18.949
+29.843
-273.94%
jan 1, 1985
10.944
-8.005
-42.24%
jan 1, 1986
2.71
-8.234
-75.24%
jan 1, 1987
12.181
+9.472
349.56%
jan 1, 1988
2.854
-9.327
-76.57%
jan 1, 1989
3.588
+0.734
25.72%
jan 1, 1990
3.505
-0.083
-2.31%
jan 1, 1991
2.991
-0.515
-14.68%
jan 1, 1992
2.624
-0.366
-12.25%
jan 1, 1993
12.189
+9.565
364.48%
jan 1, 1994
8.112
-4.077
-33.45%
jan 1, 1995
7.112
-1.0
-12.33%
jan 1, 1996
4.531
-2.581
-36.3%
jan 1, 1997
0.697
-3.834
-84.63%
jan 1, 1998
7.273
+6.576
944.1%
jan 1, 1999
8.951
+1.679
23.08%
jan 1, 2000
0.657
-8.295
-92.66%
jan 1, 2001
3.444
+2.788
424.48%
jan 1, 2002
4.376
+0.932
27.05%
jan 1, 2003
2.827
-1.549
-35.39%
jan 1, 2004
1.663
-1.164
-41.19%
jan 1, 2005
4.548
+2.885
173.52%
jan 1, 2006
3.839
-0.709
-15.59%
jan 1, 2007
6.892
+3.053
79.54%
jan 1, 2008
1.928
-4.964
-72.03%
jan 1, 2009
4.035
+2.108
109.32%
jan 1, 2010
-1.04
-5.076
-125.78%
jan 1, 2011
9.407
+10.447
-1.0K%
jan 1, 2012
4.943
-4.464
-47.45%
jan 1, 2013
4.008
-0.935
-18.92%
jan 1, 2014
4.108
+0.1
2.49%
jan 1, 2015
2.057
-2.051
-49.93%
Ranking of countries by current statistics by years


Comments: