29
/
en
AIzaSyAYiBZKx7MnpbEhh9jyipgxe19OcubqV5w
April 1, 2024
164413
Jordan
JOR
true
2
1
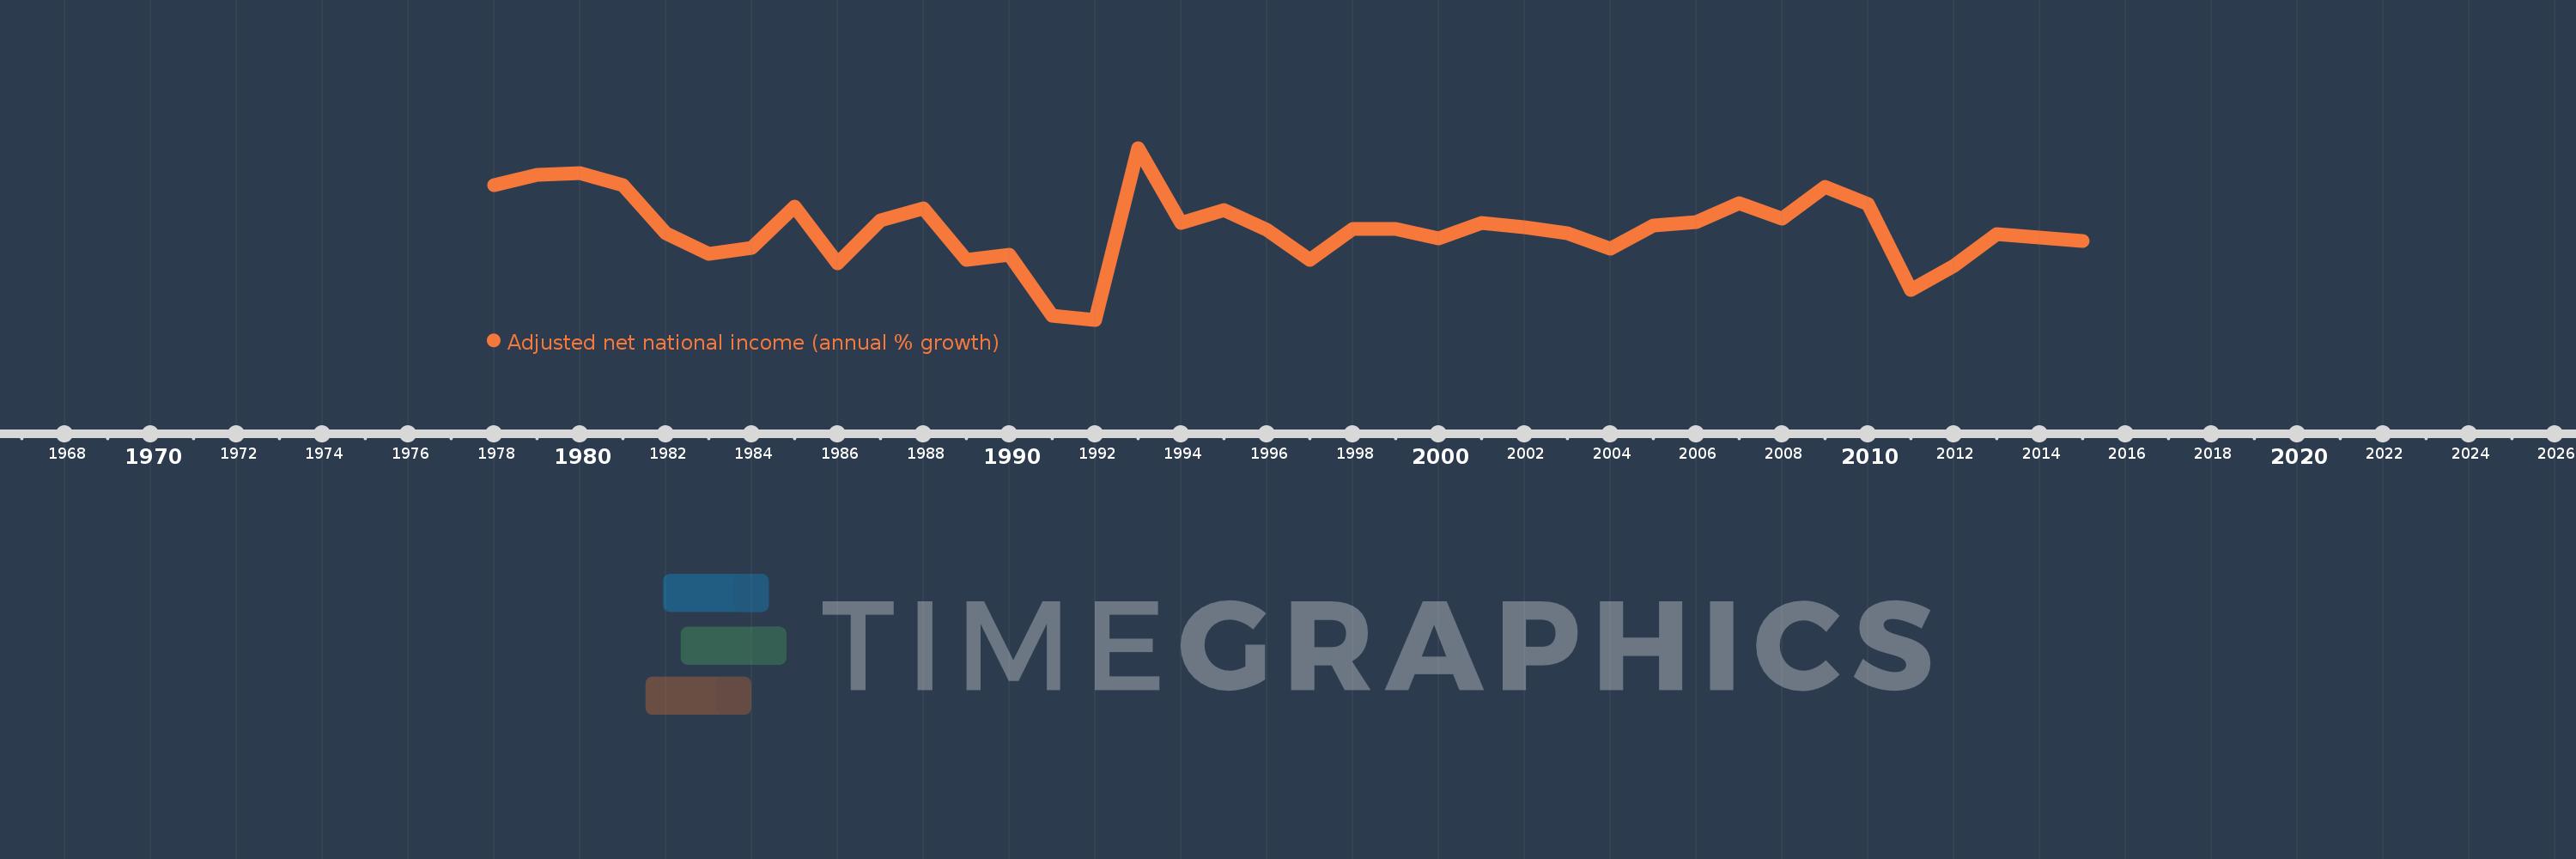
Adjusted net national income (annual % growth)
2015,2014,2013,2012,2011,2010,2009,2008,2007,2006,2005,2004,2003,2002,2001,2000,1999,1998,1997,1996,1995,1994,1993,1992,1991,1990,1989,1988,1987,1986,1985,1984,1983,1982,1981,1980,1979,1978
This statistics in other country:
Timeline:
This timeline shows a graph from 1978 to 2015 of Jordan. No data until 1977. Number of actual observations by date: 38.
Source name:
World Development Indicators
Source organization:
World Bank staff estimates based on sources and methods in World Bank's "The Changing Wealth of Nations: Measuring Sustainable Development in the New Millennium" (2011).
Categories, topics:
Economy & Growth
Last updated:
apr 23, 2017
Indicators value changes by year
Minimum:
-15.506
jan 1, 1992
Maximum:
23.645
jan 1, 1993
At the date of observation
Value
Absolute change
Change from previous value
jan 1, 1978
15.199
+15.199
0.0%
jan 1, 1979
17.473
+2.274
14.96%
jan 1, 1980
17.922
+0.448
2.57%
jan 1, 1981
15.212
-2.71
-15.12%
jan 1, 1982
4.189
-11.023
-72.46%
jan 1, 1983
-0.44
-4.628
-110.5%
jan 1, 1984
0.853
+1.292
-293.94%
jan 1, 1985
10.359
+9.506
1.12K%
jan 1, 1986
-2.653
-13.012
-125.61%
jan 1, 1987
7.19
+9.843
-371.01%
jan 1, 1988
9.978
+2.787
38.77%
jan 1, 1989
-1.9
-11.878
-119.04%
jan 1, 1990
-0.696
+1.204
-63.38%
jan 1, 1991
-14.553
-13.857
1.99K%
jan 1, 1992
-15.506
-0.952
6.55%
jan 1, 1993
23.645
+39.151
-252.49%
jan 1, 1994
6.481
-17.164
-72.59%
jan 1, 1995
9.563
+3.082
47.55%
jan 1, 1996
4.997
-4.567
-47.75%
jan 1, 1997
-1.793
-6.789
-135.88%
jan 1, 1998
5.262
+7.055
-393.5%
jan 1, 1999
5.108
-0.154
-2.93%
jan 1, 2000
2.961
-2.147
-42.03%
jan 1, 2001
6.534
+3.573
120.66%
jan 1, 2002
5.612
-0.922
-14.11%
jan 1, 2003
4.264
-1.347
-24.01%
jan 1, 2004
0.742
-3.522
-82.6%
jan 1, 2005
5.945
+5.203
701.34%
jan 1, 2006
6.847
+0.902
15.17%
jan 1, 2007
11.072
+4.225
61.7%
jan 1, 2008
7.601
-3.471
-31.35%
jan 1, 2009
14.797
+7.196
94.67%
jan 1, 2010
10.851
-3.946
-26.67%
jan 1, 2011
-8.62
-19.471
-179.44%
jan 1, 2012
-3.208
+5.412
-62.78%
jan 1, 2013
3.959
+7.168
-223.4%
jan 1, 2014
3.323
-0.637
-16.08%
jan 1, 2015
2.386
-0.937
-28.2%
Ranking of countries by current statistics by years


Comments: