29
/
en
AIzaSyAYiBZKx7MnpbEhh9jyipgxe19OcubqV5w
April 1, 2024
231913
Samoa
WSM
true
2
1
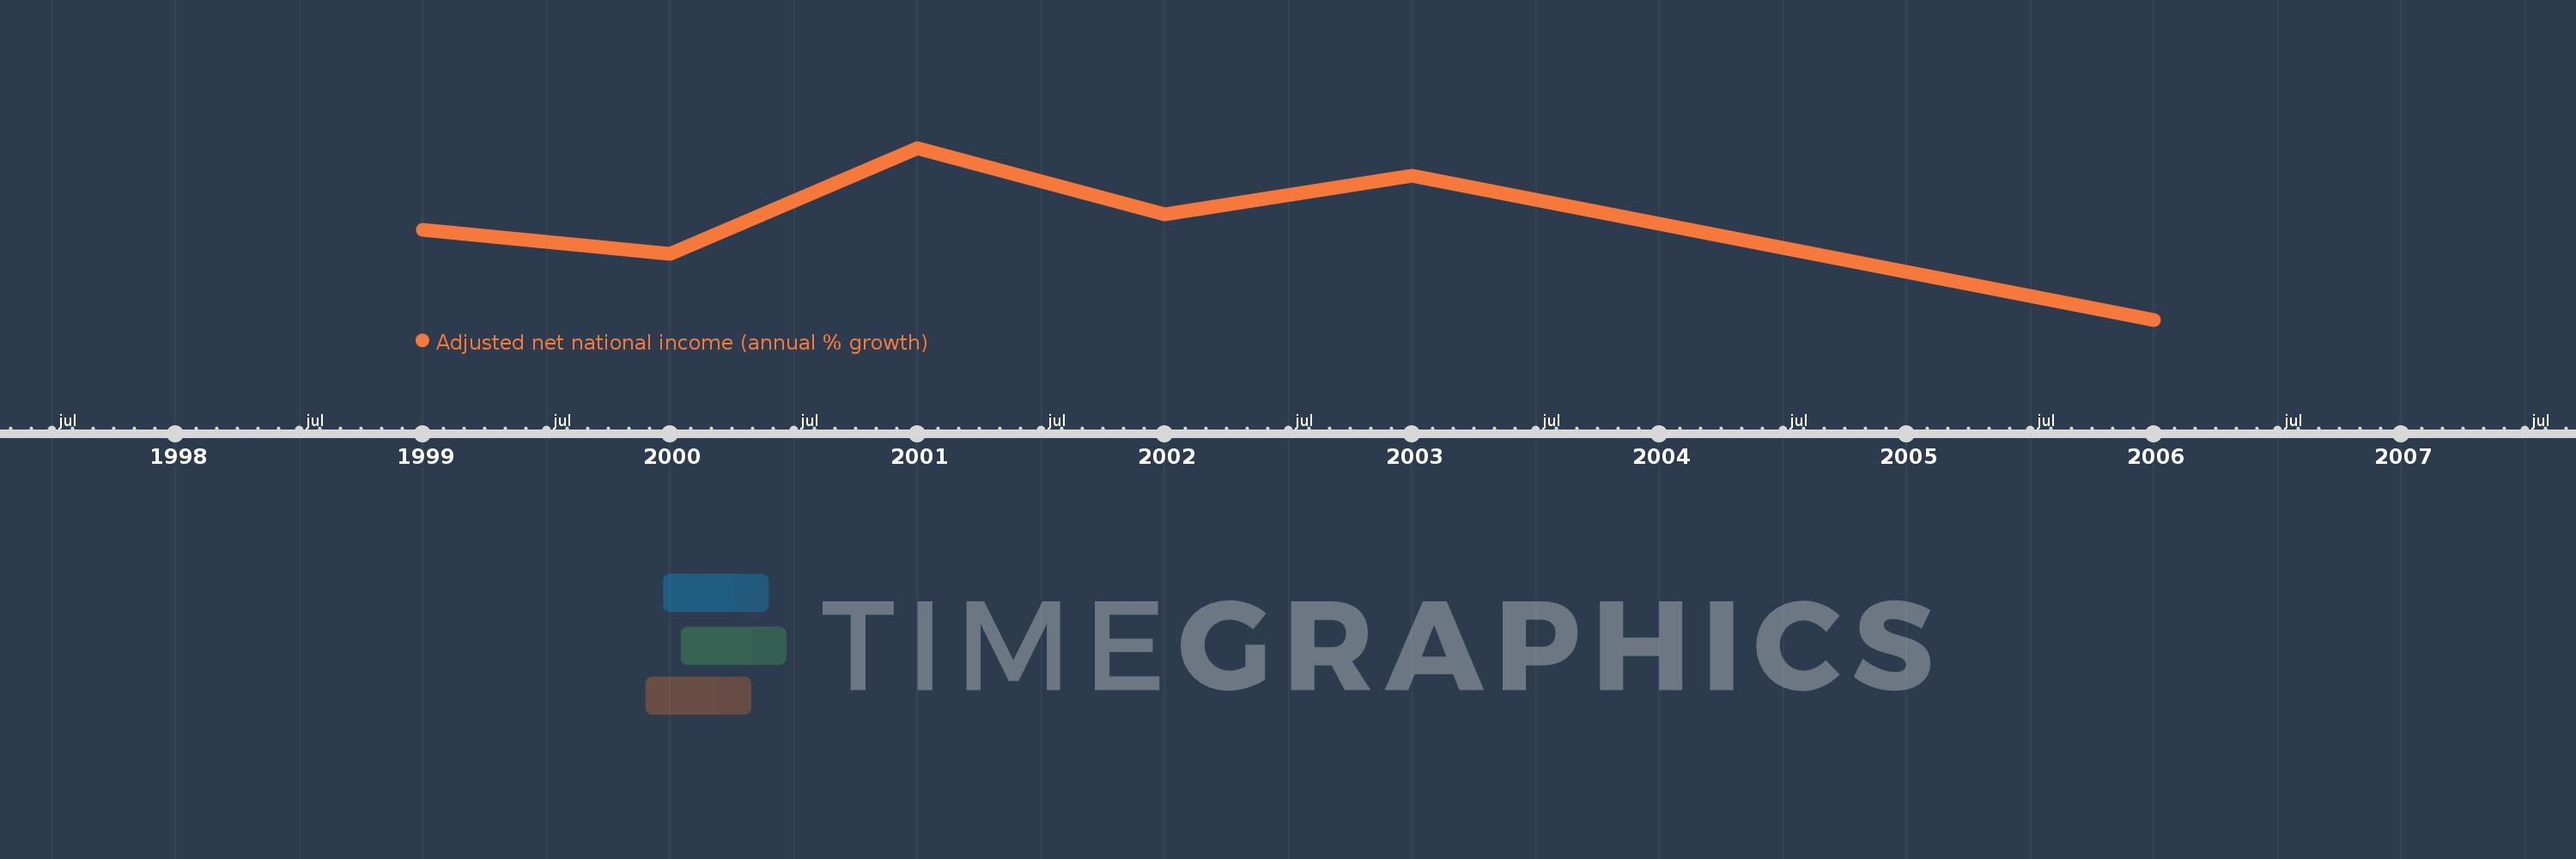
Adjusted net national income (annual % growth)
2006,2003,2002,2001,2000,1999
This statistics in other country:
Timeline:
This timeline shows a graph from 1999 to 2006 of Samoa. No data until 1998. Number of actual observations by date: 6.
Source name:
World Development Indicators
Source organization:
World Bank staff estimates based on sources and methods in World Bank's "The Changing Wealth of Nations: Measuring Sustainable Development in the New Millennium" (2011).
Categories, topics:
Economy & Growth
Last updated:
apr 23, 2017
Indicators value changes by year
Minimum:
-0.878
jan 1, 2006
At the date of observation
Value
Absolute change
Change from previous value
jan 1, 1999
2.806
+2.806
0.0%
jan 1, 2000
1.827
-0.979
-34.89%
jan 1, 2001
6.185
+4.358
238.49%
jan 1, 2002
3.442
-2.743
-44.35%
jan 1, 2003
5.035
+1.593
46.28%
jan 1, 2006
-0.878
-5.914
-117.44%
Ranking of countries by current statistics by years


Comments: