29
/
en
AIzaSyAYiBZKx7MnpbEhh9jyipgxe19OcubqV5w
April 1, 2024
256001
Sweden
SWE
true
2
1
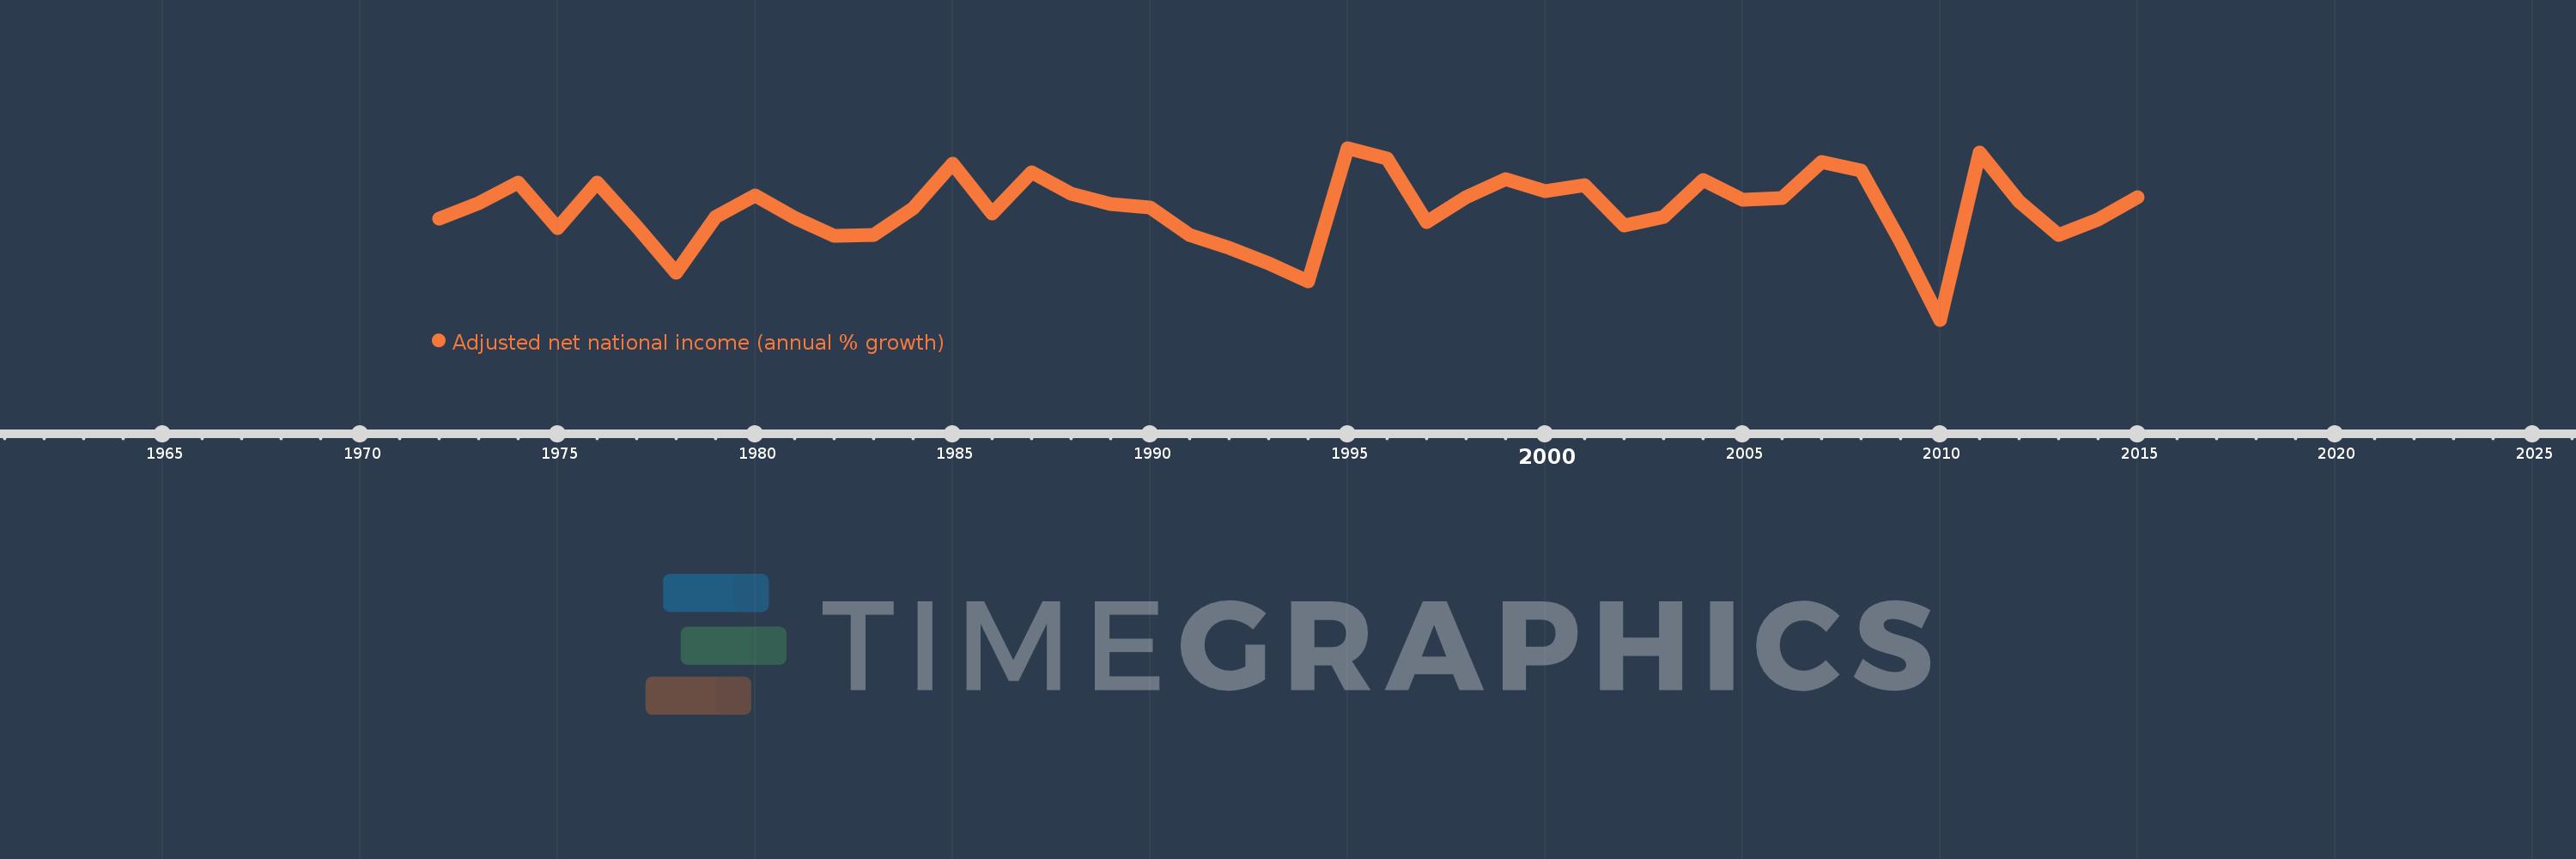
Adjusted net national income (annual % growth)
2015,2014,2013,2012,2011,2010,2009,2008,2007,2006,2005,2004,2003,2002,2001,2000,1999,1998,1997,1996,1995,1994,1993,1992,1991,1990,1989,1988,1987,1986,1985,1984,1983,1982,1981,1980,1979,1978,1977,1976,1975,1974,1973,1972
This statistics in other country:
Timeline:
This timeline shows a graph from 1972 to 2015 of Sweden. No data until 1971. Number of actual observations by date: 44.
Source name:
World Development Indicators
Source organization:
World Bank staff estimates based on sources and methods in World Bank's "The Changing Wealth of Nations: Measuring Sustainable Development in the New Millennium" (2011).
Categories, topics:
Economy & Growth
Last updated:
apr 23, 2017
Indicators value changes by year
Minimum:
-7.874
jan 1, 2010
At the date of observation
Value
Absolute change
Change from previous value
jan 1, 1972
1.03
+1.03
0.0%
jan 1, 1973
2.412
+1.382
134.19%
jan 1, 1974
4.207
+1.794
74.38%
jan 1, 1975
0.231
-3.976
-94.51%
jan 1, 1976
4.218
+3.987
1.73K%
jan 1, 1977
0.359
-3.86
-91.49%
jan 1, 1978
-3.69
-4.049
-1.13K%
jan 1, 1979
1.202
+4.892
-132.57%
jan 1, 1980
3.112
+1.91
158.87%
jan 1, 1981
1.142
-1.969
-63.29%
jan 1, 1982
-0.483
-1.625
-142.26%
jan 1, 1983
-0.367
+0.116
-24.0%
jan 1, 1984
1.945
+2.311
-629.97%
jan 1, 1985
5.942
+3.997
205.55%
jan 1, 1986
1.487
-4.455
-74.98%
jan 1, 1987
5.116
+3.629
244.15%
jan 1, 1988
3.284
-1.832
-35.82%
jan 1, 1989
2.317
-0.967
-29.44%
jan 1, 1990
2.036
-0.281
-12.14%
jan 1, 1991
-0.362
-2.397
-117.77%
jan 1, 1992
-1.493
-1.131
312.7%
jan 1, 1993
-2.92
-1.427
95.57%
jan 1, 1994
-4.483
-1.563
53.52%
jan 1, 1995
7.295
+11.778
-262.71%
jan 1, 1996
6.332
-0.962
-13.19%
jan 1, 1997
0.761
-5.571
-87.98%
jan 1, 1998
2.917
+2.156
283.26%
jan 1, 1999
4.541
+1.625
55.7%
jan 1, 2000
3.45
-1.091
-24.03%
jan 1, 2001
4.024
+0.574
16.63%
jan 1, 2002
0.409
-3.615
-89.84%
jan 1, 2003
1.208
+0.799
195.51%
jan 1, 2004
4.466
+3.258
269.64%
jan 1, 2005
2.744
-1.722
-38.56%
jan 1, 2006
2.896
+0.152
5.55%
jan 1, 2007
6.023
+3.127
107.96%
jan 1, 2008
5.324
-0.699
-11.6%
jan 1, 2009
-1.016
-6.34
-119.08%
jan 1, 2010
-7.874
-6.859
675.33%
jan 1, 2011
6.895
+14.769
-187.56%
jan 1, 2012
2.576
-4.319
-62.64%
jan 1, 2013
-0.374
-2.95
-114.53%
jan 1, 2014
0.994
+1.369
-365.57%
jan 1, 2015
2.916
+1.922
193.29%
Ranking of countries by current statistics by years


Comments: