29
/
en
AIzaSyAYiBZKx7MnpbEhh9jyipgxe19OcubqV5w
April 1, 2024
31266
Europe & Central Asia (excluding high income)
ECA
false
2
1
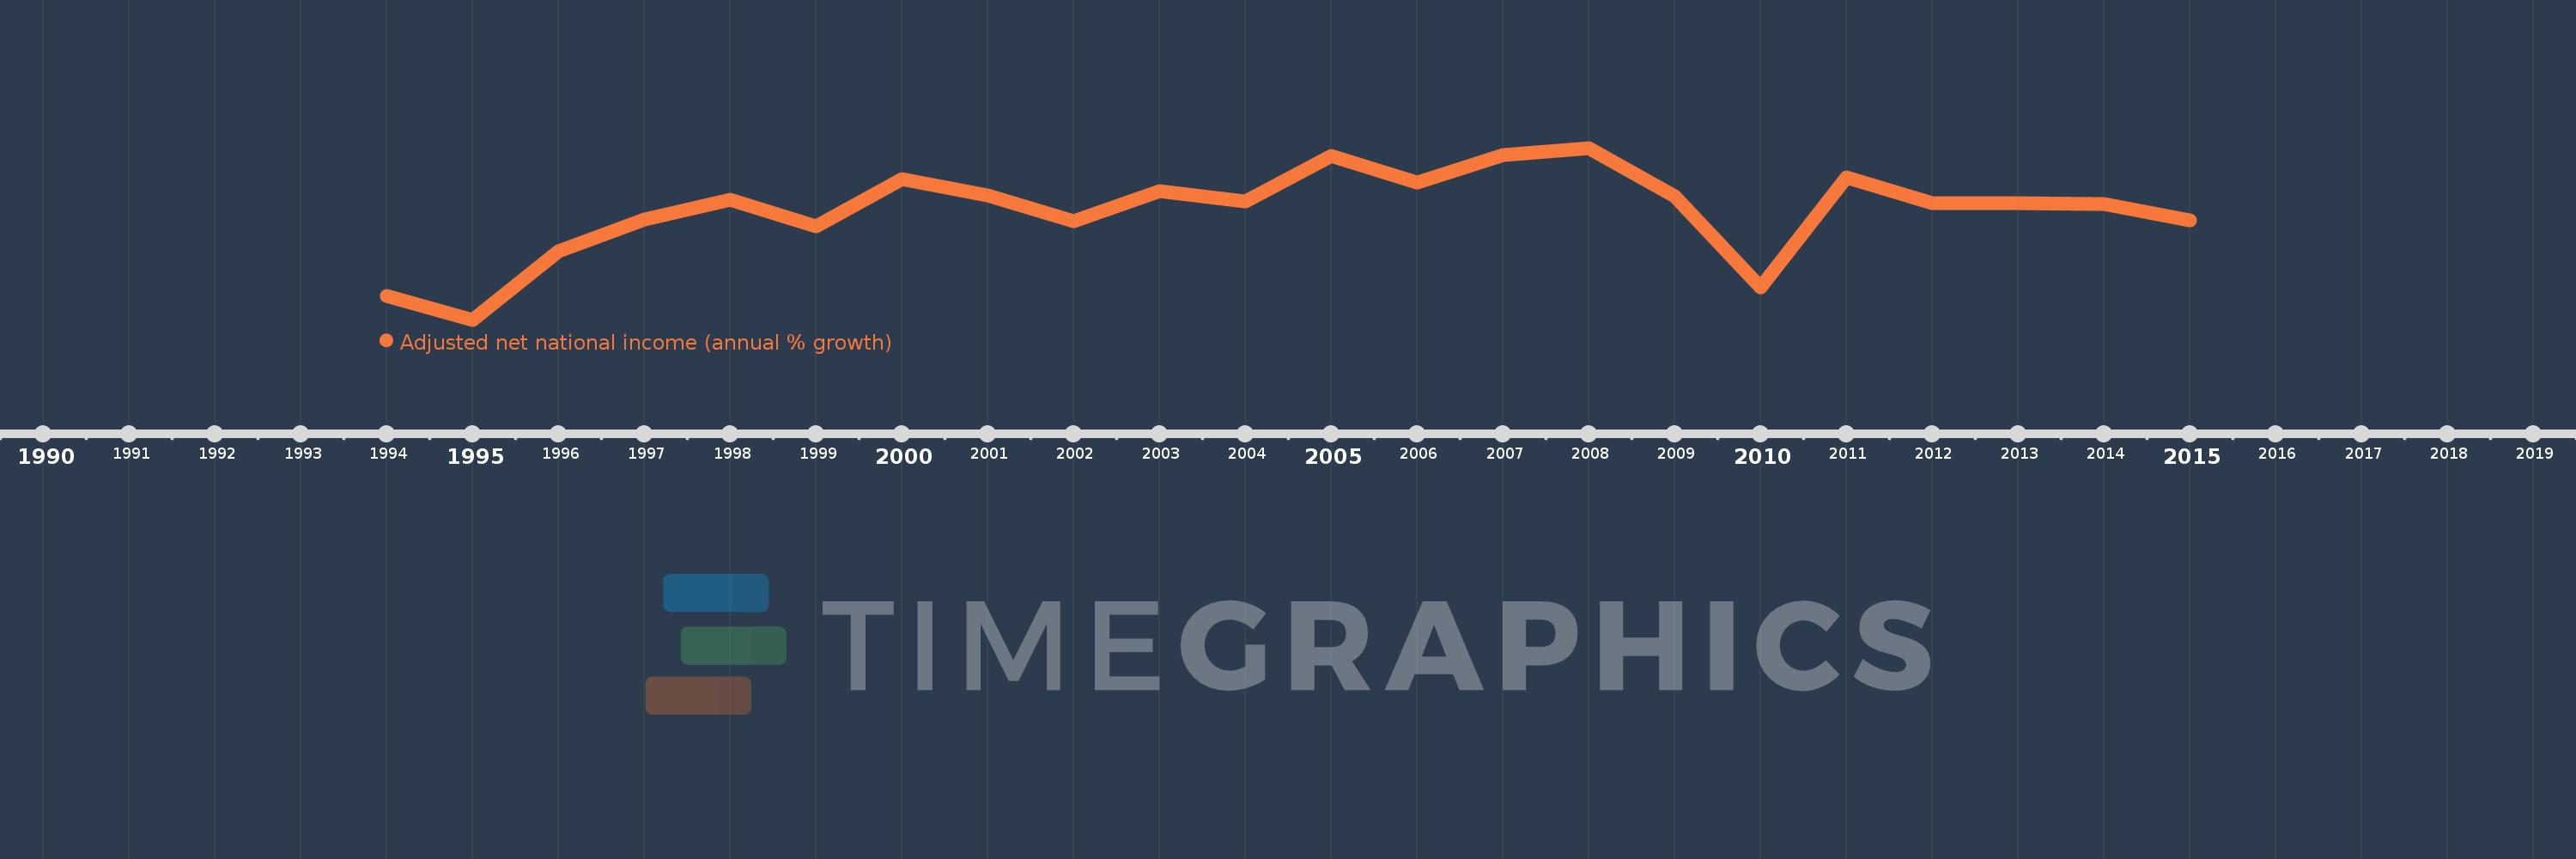
Adjusted net national income (annual % growth)
2015,2014,2013,2012,2011,2010,2009,2008,2007,2006,2005,2004,2003,2002,2001,2000,1999,1998,1997,1996,1995,1994
This statistics in other country:
Timeline:
This timeline shows a graph from 1994 to 2015 of Europe & Central Asia (excluding high income). No data until 1993. Number of actual observations by date: 22.
Source name:
World Development Indicators
Source organization:
World Bank staff estimates based on sources and methods in World Bank's "The Changing Wealth of Nations: Measuring Sustainable Development in the New Millennium" (2011).
Categories, topics:
Economy & Growth
Last updated:
apr 23, 2017
Indicators value changes by year
Minimum:
-12.102
jan 1, 1995
Maximum:
11.578
jan 1, 2008
At the date of observation
Value
Absolute change
Change from previous value
jan 1, 1994
-8.778
-8.778
0.0%
jan 1, 1995
-12.102
-3.324
37.87%
jan 1, 1996
-2.704
+9.398
-77.65%
jan 1, 1997
1.724
+4.429
-163.76%
jan 1, 1998
4.393
+2.668
154.75%
jan 1, 1999
0.795
-3.598
-81.91%
jan 1, 2000
7.264
+6.469
814.05%
jan 1, 2001
5.081
-2.183
-30.05%
jan 1, 2002
1.442
-3.64
-71.63%
jan 1, 2003
5.676
+4.234
293.72%
jan 1, 2004
4.208
-1.467
-25.85%
jan 1, 2005
10.51
+6.302
149.75%
jan 1, 2006
6.863
-3.647
-34.7%
jan 1, 2007
10.607
+3.744
54.55%
jan 1, 2008
11.578
+0.97
9.15%
jan 1, 2009
4.892
-6.685
-57.74%
jan 1, 2010
-7.646
-12.538
-256.28%
jan 1, 2011
7.51
+15.155
-198.22%
jan 1, 2012
3.925
-3.584
-47.73%
jan 1, 2013
3.974
+0.049
1.26%
jan 1, 2014
3.815
-0.159
-4.0%
jan 1, 2015
1.541
-2.275
-59.62%
Ranking of countries by current statistics by years


Comments: