29
/
en
AIzaSyAYiBZKx7MnpbEhh9jyipgxe19OcubqV5w
April 1, 2024
79144
Barbados
BRB
true
2
1
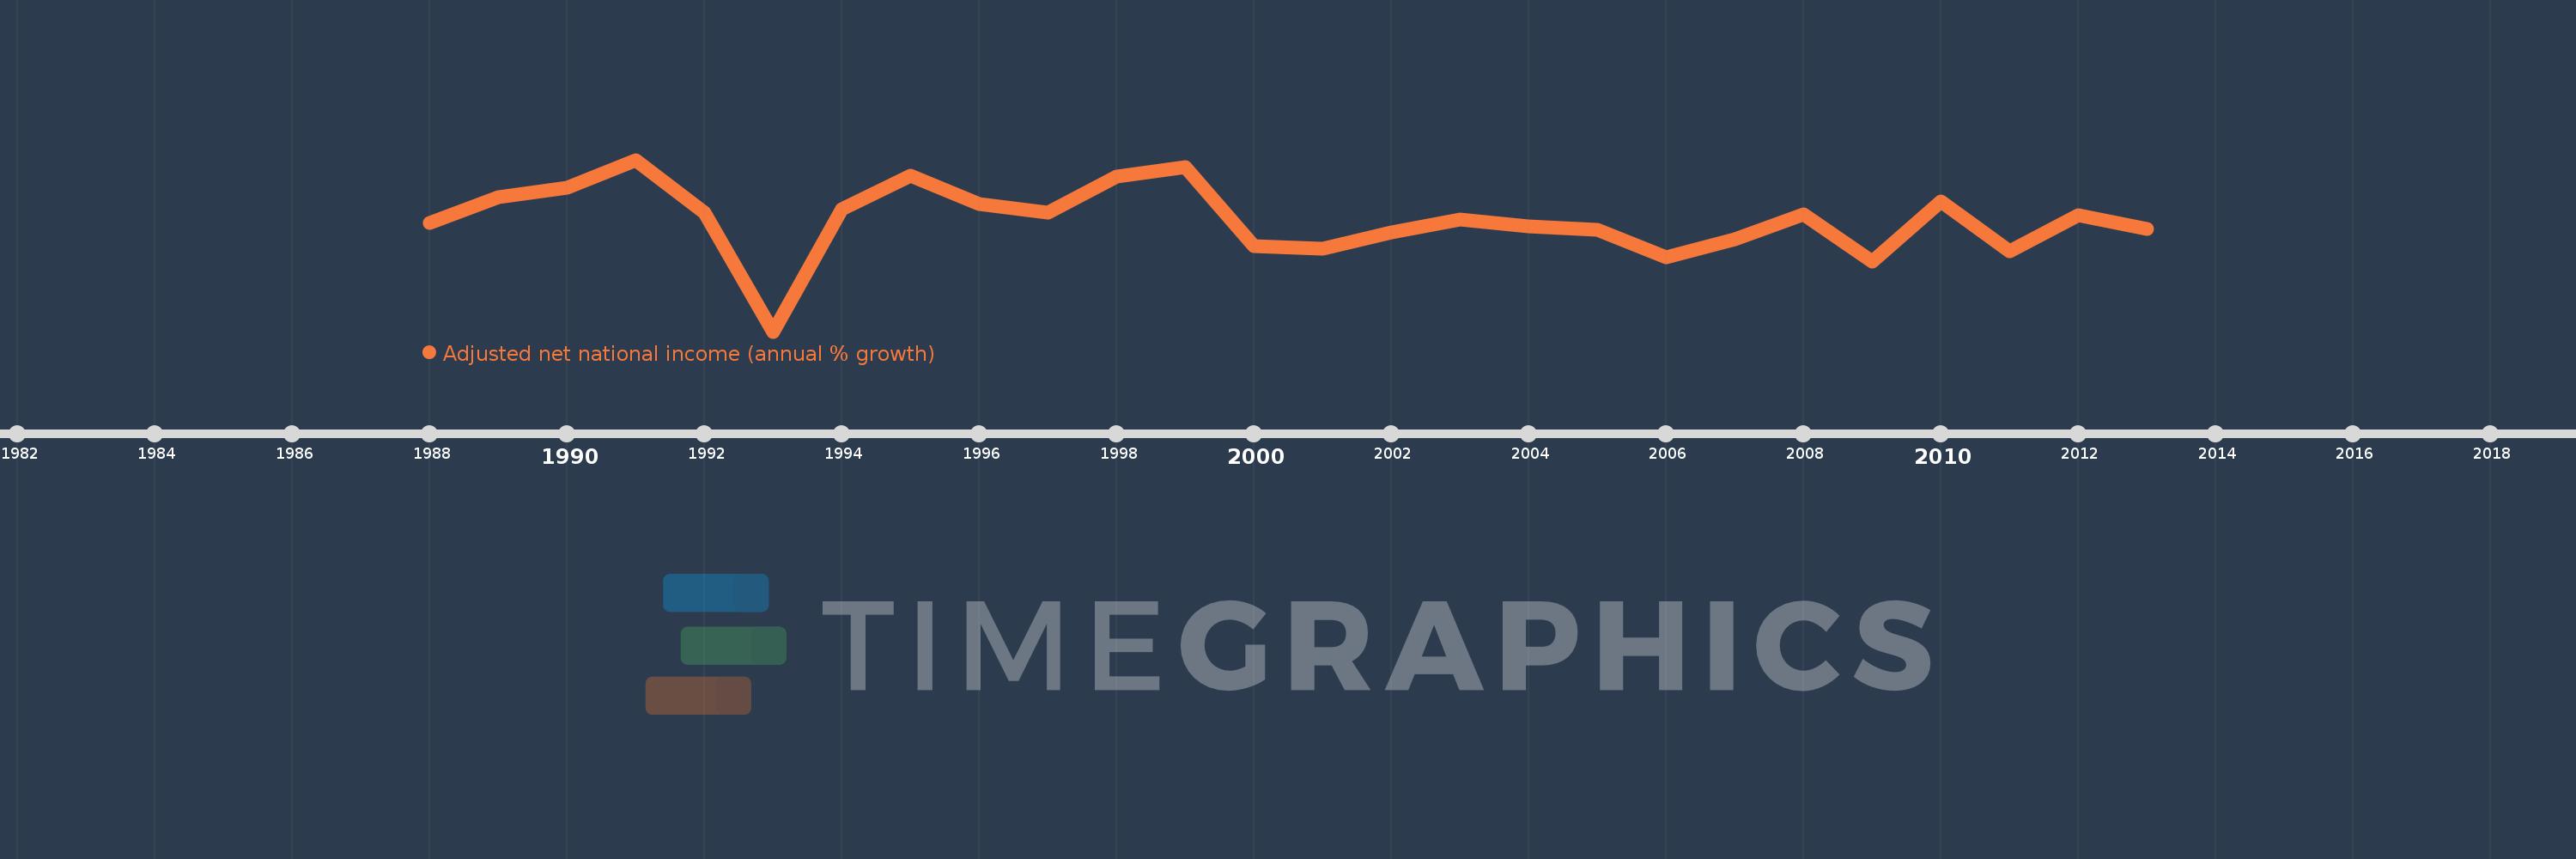
Adjusted net national income (annual % growth)
2013,2012,2011,2010,2009,2008,2007,2006,2005,2004,2003,2002,2001,2000,1999,1998,1997,1996,1995,1994,1993,1992,1991,1990,1989,1988
This statistics in other country:
Timeline:
This timeline shows a graph from 1988 to 2013 of Barbados. No data until 1987. Number of actual observations by date: 26.
Source name:
World Development Indicators
Source organization:
World Bank staff estimates based on sources and methods in World Bank's "The Changing Wealth of Nations: Measuring Sustainable Development in the New Millennium" (2011).
Categories, topics:
Economy & Growth
Last updated:
apr 23, 2017
Indicators value changes by year
Minimum:
-16.14
jan 1, 1993
Maximum:
10.109
jan 1, 1991
At the date of observation
Value
Absolute change
Change from previous value
jan 1, 1988
0.452
+0.452
0.0%
jan 1, 1989
4.413
+3.962
877.2%
jan 1, 1990
5.854
+1.44
32.64%
jan 1, 1991
10.109
+4.255
72.69%
jan 1, 1992
2.013
-8.096
-80.09%
jan 1, 1993
-16.14
-18.153
-901.73%
jan 1, 1994
2.533
+18.673
-115.69%
jan 1, 1995
7.714
+5.181
204.53%
jan 1, 1996
3.384
-4.329
-56.12%
jan 1, 1997
2.05
-1.335
-39.44%
jan 1, 1998
7.53
+5.481
267.4%
jan 1, 1999
8.969
+1.439
19.11%
jan 1, 2000
-3.102
-12.071
-134.59%
jan 1, 2001
-3.472
-0.369
11.91%
jan 1, 2002
-0.945
+2.527
-72.78%
jan 1, 2003
1.01
+1.955
-206.88%
jan 1, 2004
-0.106
-1.116
-110.49%
jan 1, 2005
-0.653
-0.547
515.88%
jan 1, 2006
-4.779
-4.127
632.44%
jan 1, 2007
-2.001
+2.778
-58.13%
jan 1, 2008
1.742
+3.743
-187.05%
jan 1, 2009
-5.469
-7.211
-413.95%
jan 1, 2010
3.809
+9.277
-169.64%
jan 1, 2011
-3.896
-7.705
-202.3%
jan 1, 2012
1.673
+5.569
-142.94%
jan 1, 2013
-0.472
-2.145
-128.21%
Ranking of countries by current statistics by years


Comments: