29
/
en
AIzaSyAYiBZKx7MnpbEhh9jyipgxe19OcubqV5w
April 1, 2024
118591
Denmark
DNK
true
2
1
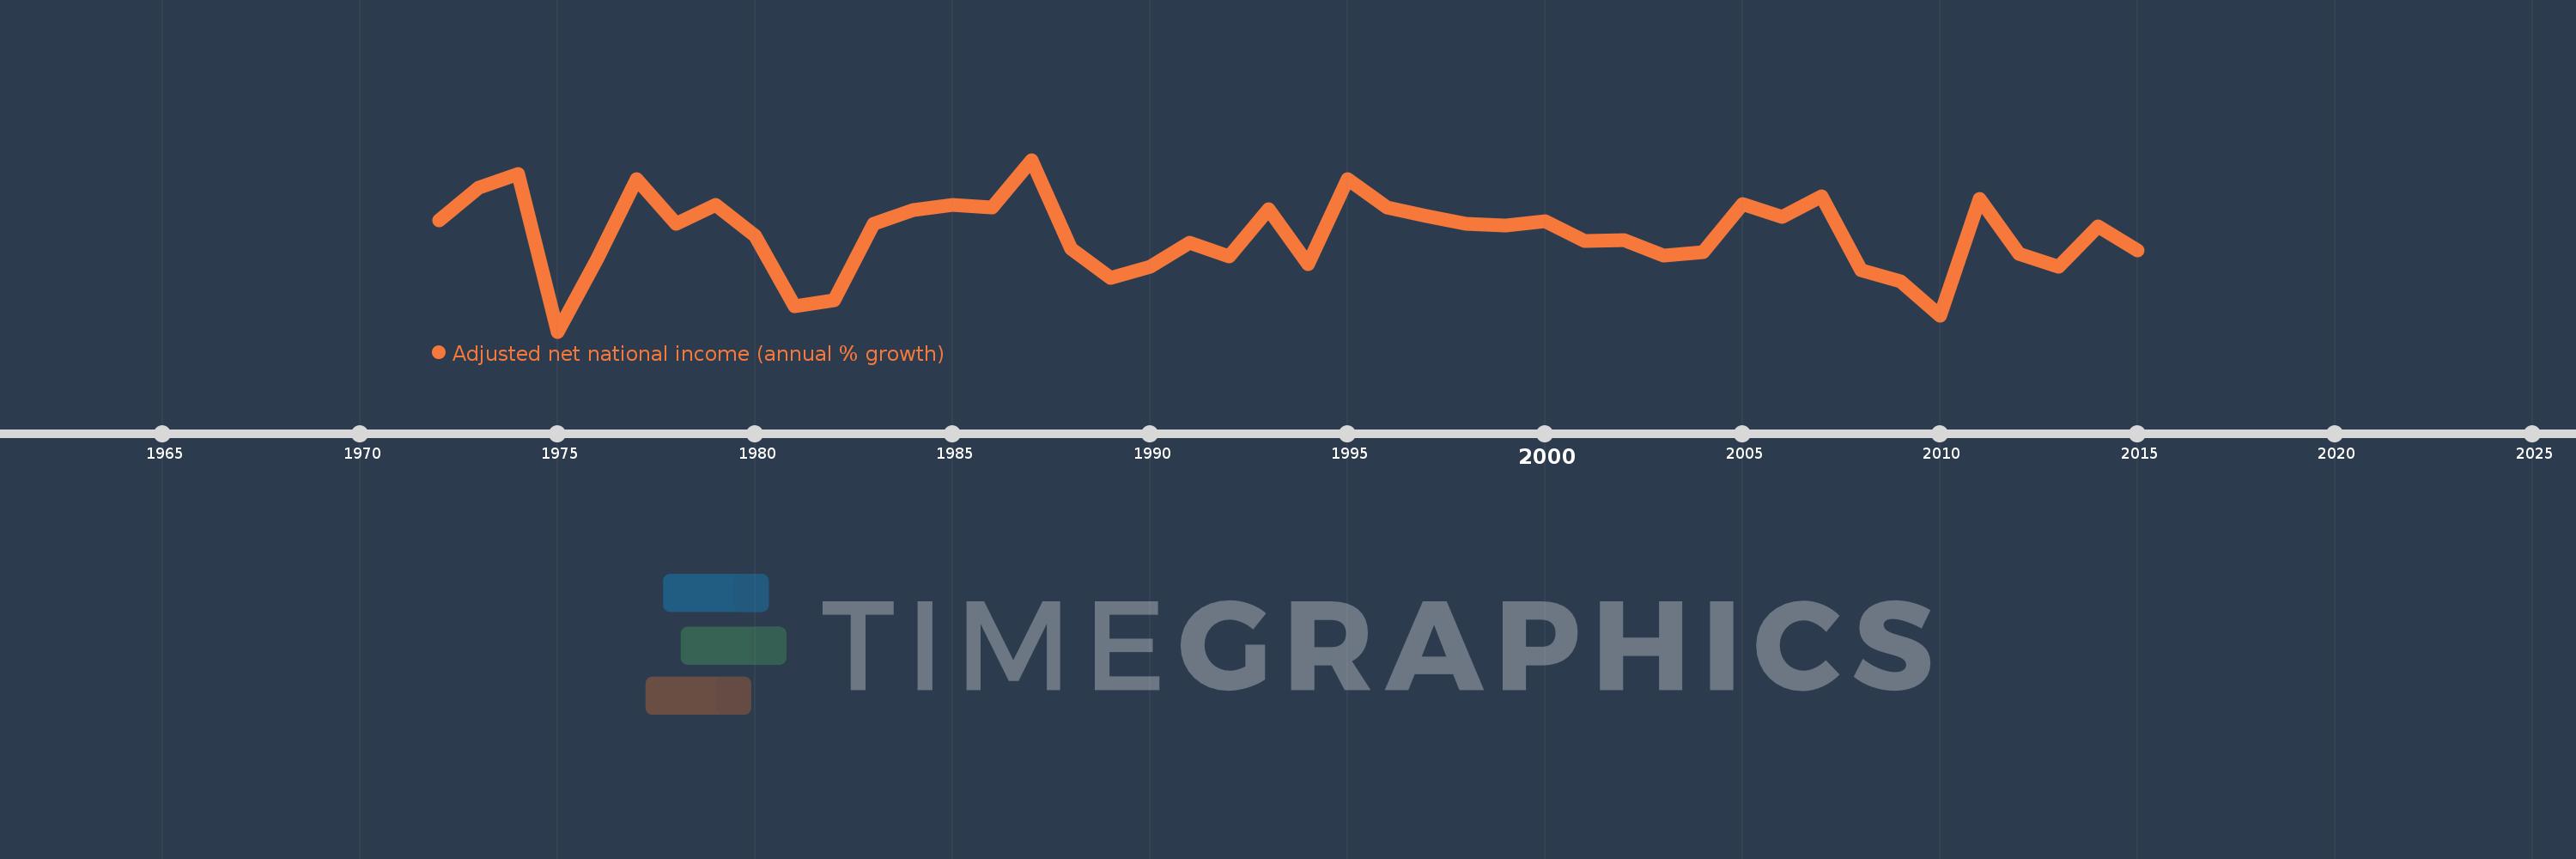
Adjusted net national income (annual % growth)
2015,2014,2013,2012,2011,2010,2009,2008,2007,2006,2005,2004,2003,2002,2001,2000,1999,1998,1997,1996,1995,1994,1993,1992,1991,1990,1989,1988,1987,1986,1985,1984,1983,1982,1981,1980,1979,1978,1977,1976,1975,1974,1973,1972
This statistics in other country:
Timeline:
This timeline shows a graph from 1972 to 2015 of Denmark. No data until 1971. Number of actual observations by date: 44.
Source name:
World Development Indicators
Source organization:
World Bank staff estimates based on sources and methods in World Bank's "The Changing Wealth of Nations: Measuring Sustainable Development in the New Millennium" (2011).
Categories, topics:
Economy & Growth
Last updated:
apr 23, 2017
Indicators value changes by year
Minimum:
-4.674
jan 1, 1975
At the date of observation
Value
Absolute change
Change from previous value
jan 1, 1972
2.794
+2.794
0.0%
jan 1, 1973
5.005
+2.212
79.17%
jan 1, 1974
5.909
+0.904
18.07%
jan 1, 1975
-4.674
-10.584
-179.1%
jan 1, 1976
0.171
+4.845
-103.65%
jan 1, 1977
5.555
+5.384
3.15K%
jan 1, 1978
2.578
-2.977
-53.59%
jan 1, 1979
3.844
+1.266
49.11%
jan 1, 1980
1.736
-2.108
-54.84%
jan 1, 1981
-2.977
-4.713
-271.49%
jan 1, 1982
-2.588
+0.389
-13.06%
jan 1, 1983
2.561
+5.149
-198.94%
jan 1, 1984
3.49
+0.929
36.26%
jan 1, 1985
3.808
+0.318
9.13%
jan 1, 1986
3.659
-0.149
-3.91%
jan 1, 1987
6.851
+3.192
87.23%
jan 1, 1988
0.869
-5.982
-87.32%
jan 1, 1989
-1.085
-1.954
-224.95%
jan 1, 1990
-0.328
+0.757
-69.74%
jan 1, 1991
1.266
+1.594
-485.36%
jan 1, 1992
0.375
-0.89
-70.34%
jan 1, 1993
3.514
+3.138
836.03%
jan 1, 1994
-0.136
-3.65
-103.88%
jan 1, 1995
5.539
+5.675
-4.16K%
jan 1, 1996
3.657
-1.882
-33.98%
jan 1, 1997
3.084
-0.573
-15.67%
jan 1, 1998
2.535
-0.548
-17.78%
jan 1, 1999
2.428
-0.108
-4.25%
jan 1, 2000
2.716
+0.288
11.87%
jan 1, 2001
1.408
-1.308
-48.16%
jan 1, 2002
1.463
+0.055
3.93%
jan 1, 2003
0.431
-1.033
-70.57%
jan 1, 2004
0.675
+0.244
56.64%
jan 1, 2005
3.898
+3.223
477.69%
jan 1, 2006
3.016
-0.882
-22.62%
jan 1, 2007
4.388
+1.371
45.47%
jan 1, 2008
-0.547
-4.935
-112.47%
jan 1, 2009
-1.306
-0.759
138.64%
jan 1, 2010
-3.599
-2.293
175.58%
jan 1, 2011
4.208
+7.808
-216.91%
jan 1, 2012
0.557
-3.651
-86.75%
jan 1, 2013
-0.348
-0.906
-162.5%
jan 1, 2014
2.375
+2.723
-781.67%
jan 1, 2015
0.776
-1.598
-67.3%
Ranking of countries by current statistics by years


Comments: