29
/
en
AIzaSyAYiBZKx7MnpbEhh9jyipgxe19OcubqV5w
April 1, 2024
215966
Pakistan
PAK
true
2
1
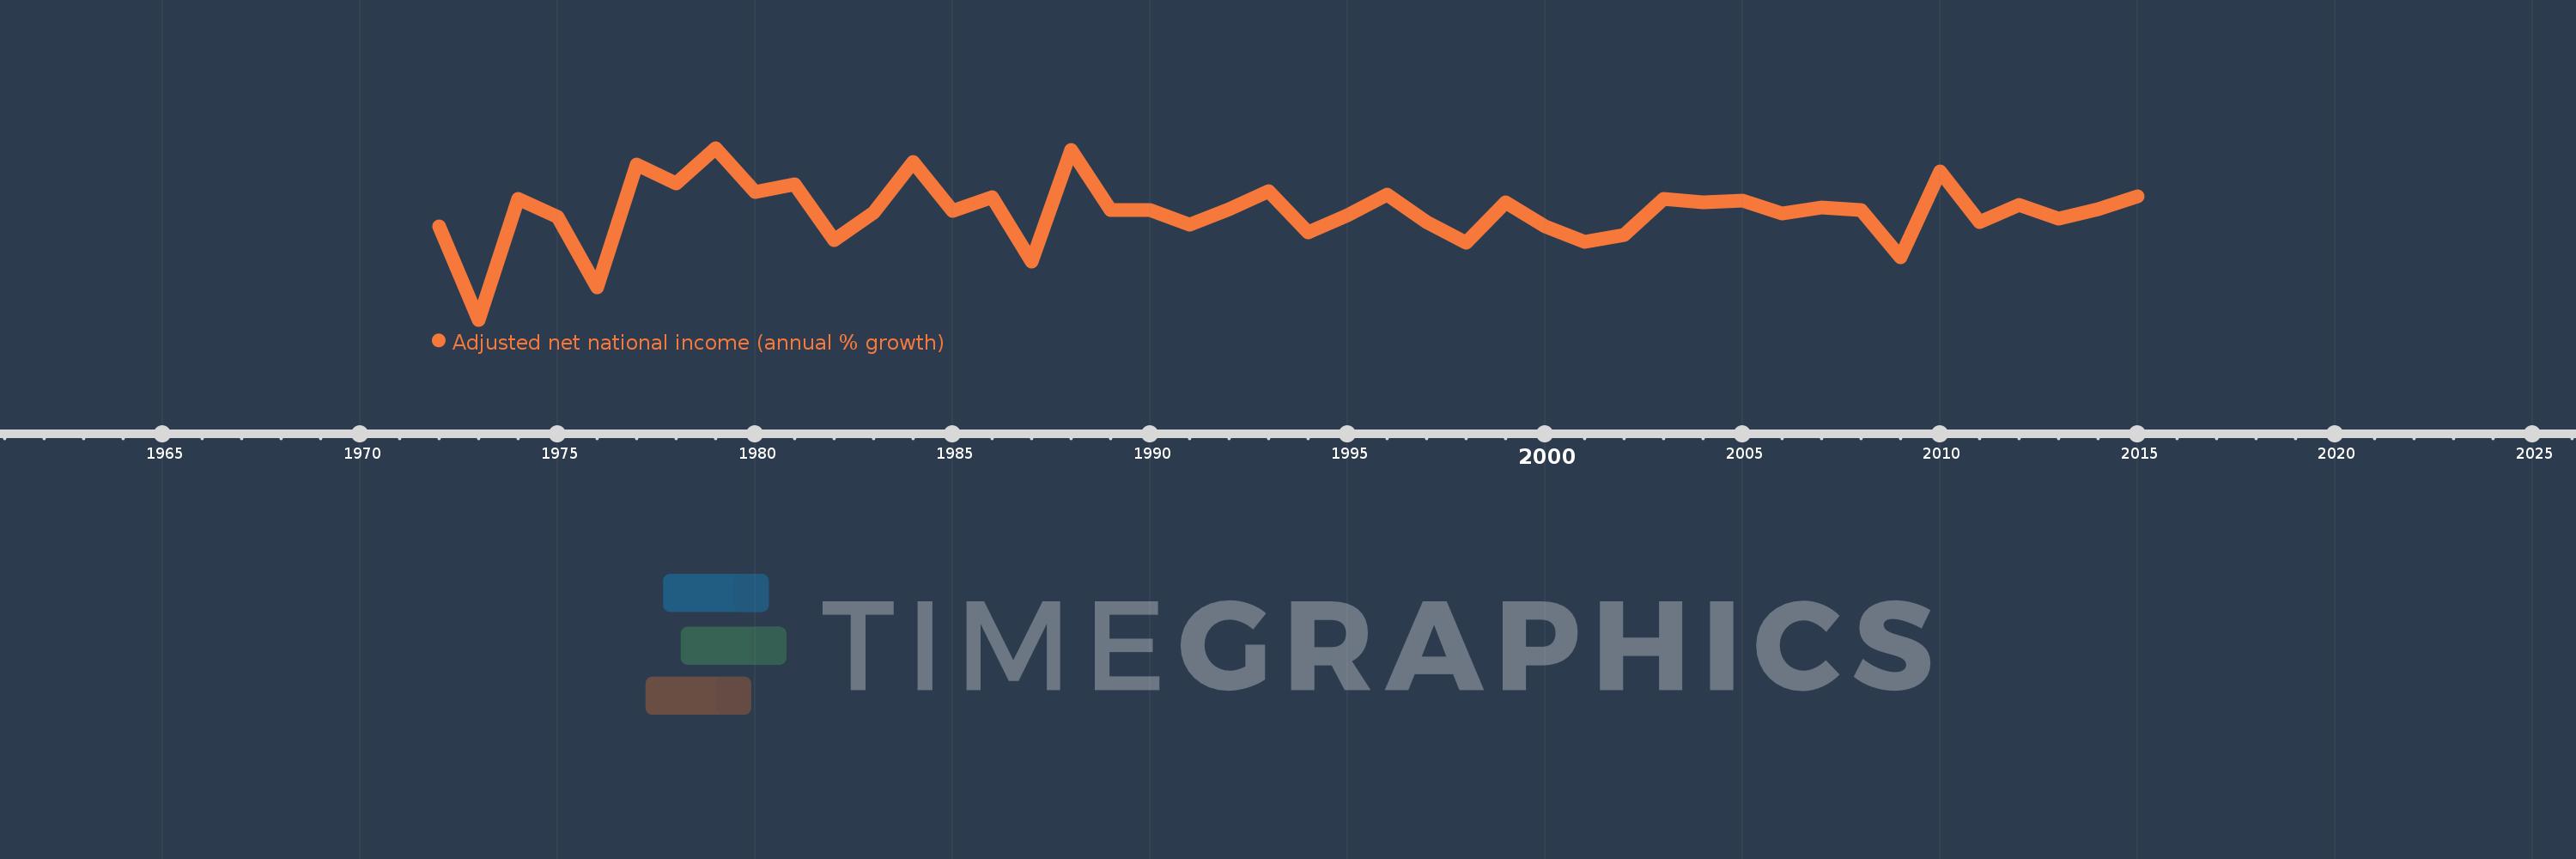
Adjusted net national income (annual % growth)
2015,2014,2013,2012,2011,2010,2009,2008,2007,2006,2005,2004,2003,2002,2001,2000,1999,1998,1997,1996,1995,1994,1993,1992,1991,1990,1989,1988,1987,1986,1985,1984,1983,1982,1981,1980,1979,1978,1977,1976,1975,1974,1973,1972
This statistics in other country:
Timeline:
This timeline shows a graph from 1972 to 2015 of Pakistan. No data until 1971. Number of actual observations by date: 44.
Source name:
World Development Indicators
Source organization:
World Bank staff estimates based on sources and methods in World Bank's "The Changing Wealth of Nations: Measuring Sustainable Development in the New Millennium" (2011).
Categories, topics:
Economy & Growth
Last updated:
apr 23, 2017
Indicators value changes by year
Maximum:
12.661
jan 1, 1979
At the date of observation
Value
Absolute change
Change from previous value
jan 1, 1972
2.376
+2.376
0.0%
jan 1, 1973
-9.98
-12.356
-520.01%
jan 1, 1974
5.903
+15.883
-159.15%
jan 1, 1975
3.569
-2.334
-39.55%
jan 1, 1976
-5.764
-9.333
-261.52%
jan 1, 1977
10.499
+16.263
-282.15%
jan 1, 1978
7.942
-2.557
-24.35%
jan 1, 1979
12.661
+4.718
59.41%
jan 1, 1980
6.858
-5.803
-45.83%
jan 1, 1981
7.85
+0.991
14.46%
jan 1, 1982
0.484
-7.366
-93.83%
jan 1, 1983
4.092
+3.608
745.48%
jan 1, 1984
10.795
+6.703
163.8%
jan 1, 1985
4.417
-6.379
-59.09%
jan 1, 1986
6.212
+1.795
40.65%
jan 1, 1987
-2.312
-8.524
-137.22%
jan 1, 1988
12.384
+14.696
-635.65%
jan 1, 1989
4.515
-7.869
-63.54%
jan 1, 1990
4.503
-0.012
-0.26%
jan 1, 1991
2.582
-1.922
-42.67%
jan 1, 1992
4.58
+1.998
77.37%
jan 1, 1993
6.936
+2.356
51.45%
jan 1, 1994
1.48
-5.455
-78.66%
jan 1, 1995
3.743
+2.263
152.87%
jan 1, 1996
6.539
+2.796
74.69%
jan 1, 1997
2.922
-3.617
-55.31%
jan 1, 1998
0.204
-2.718
-93.02%
jan 1, 1999
5.51
+5.306
2.6K%
jan 1, 2000
2.273
-3.237
-58.75%
jan 1, 2001
0.286
-1.986
-87.39%
jan 1, 2002
1.233
+0.947
330.44%
jan 1, 2003
5.9
+4.667
378.45%
jan 1, 2004
5.524
-0.376
-6.37%
jan 1, 2005
5.774
+0.25
4.53%
jan 1, 2006
4.059
-1.715
-29.7%
jan 1, 2007
4.825
+0.766
18.86%
jan 1, 2008
4.475
-0.35
-7.25%
jan 1, 2009
-1.722
-6.197
-138.48%
jan 1, 2010
9.621
+11.343
-658.7%
jan 1, 2011
2.884
-6.737
-70.02%
jan 1, 2012
5.186
+2.302
79.8%
jan 1, 2013
3.378
-1.808
-34.86%
jan 1, 2014
4.584
+1.206
35.69%
jan 1, 2015
6.305
+1.721
37.55%
Ranking of countries by current statistics by years


Comments: