29
/
en
AIzaSyAYiBZKx7MnpbEhh9jyipgxe19OcubqV5w
April 1, 2024
90706
Brazil
BRA
true
2
1
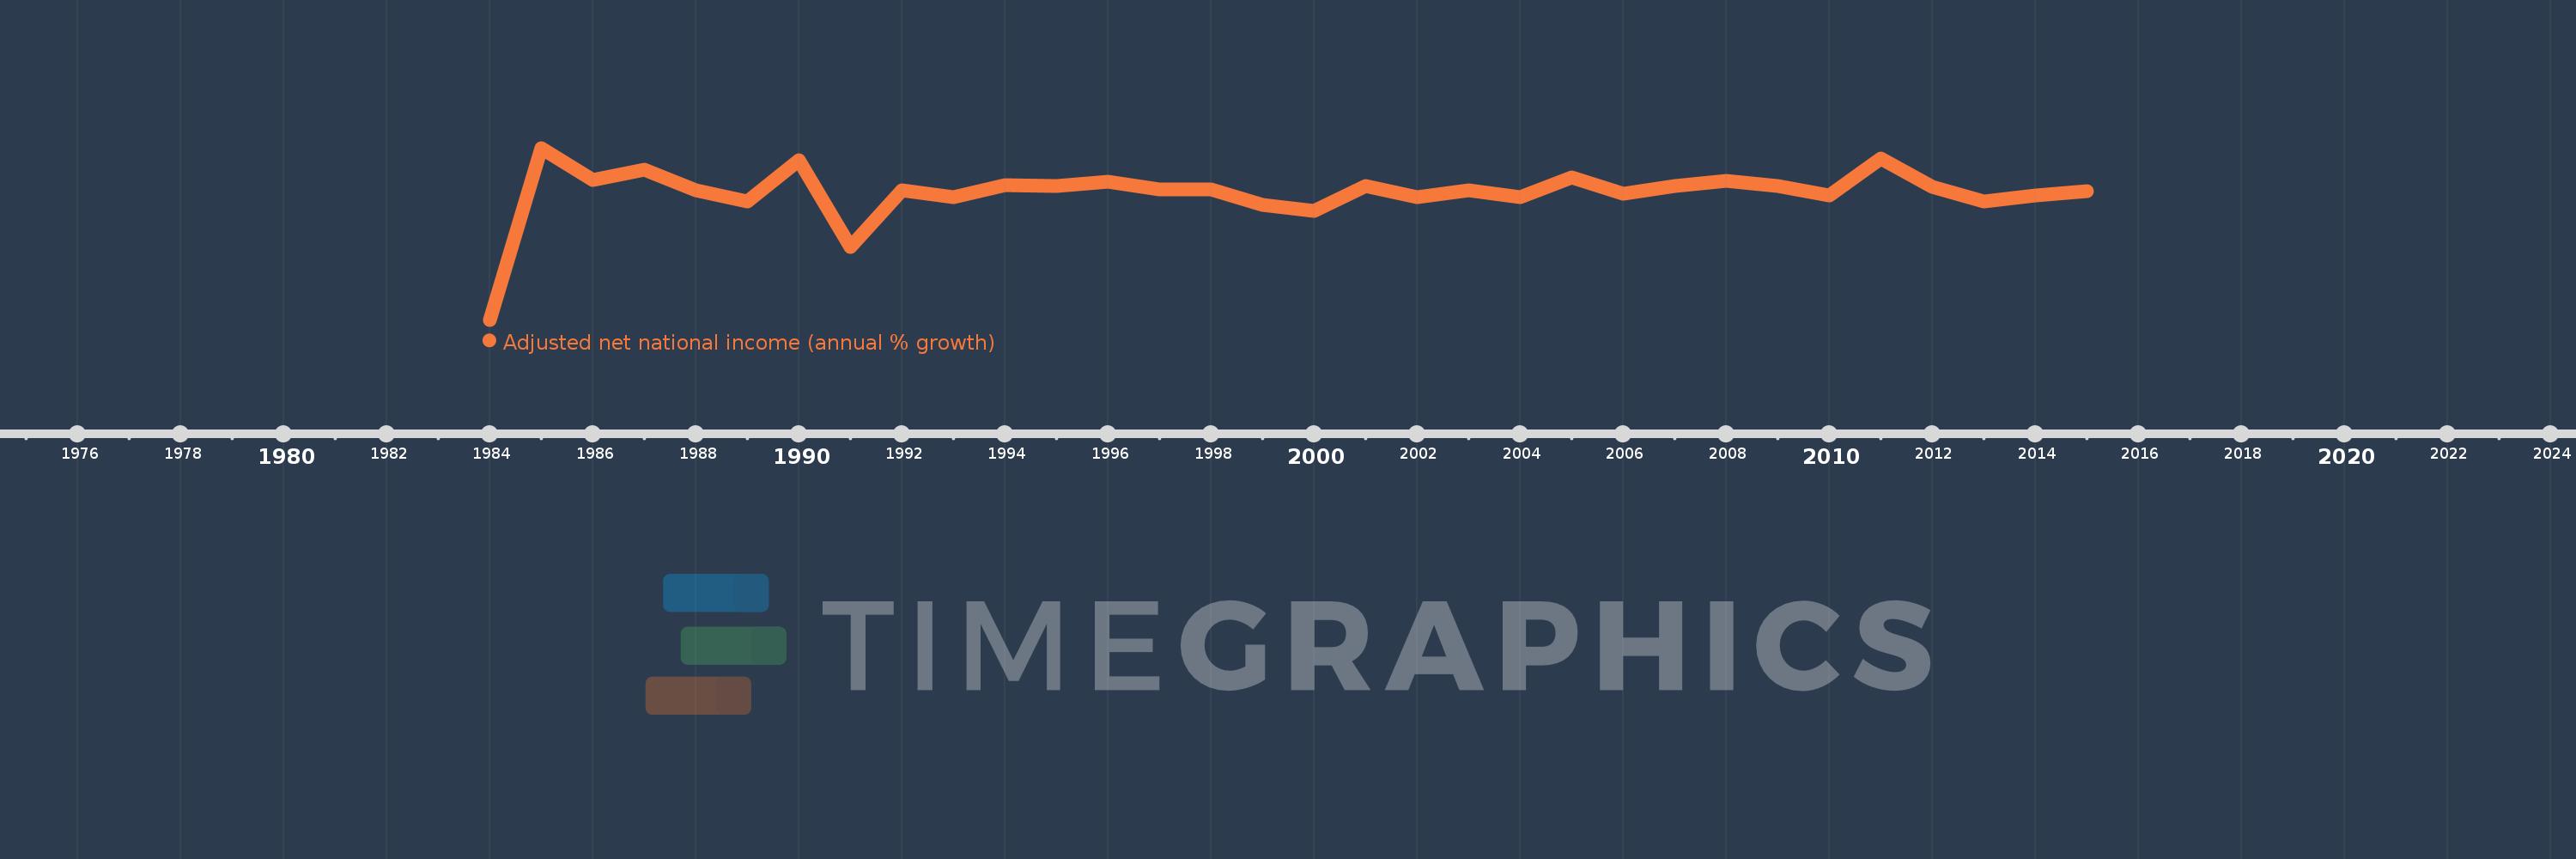
Adjusted net national income (annual % growth)
2015,2014,2013,2012,2011,2010,2009,2008,2007,2006,2005,2004,2003,2002,2001,2000,1999,1998,1997,1996,1995,1994,1993,1992,1991,1990,1989,1988,1987,1986,1985,1984
This statistics in other country:
Timeline:
This timeline shows a graph from 1984 to 2015 of Brazil. No data until 1983. Number of actual observations by date: 32.
Source name:
World Development Indicators
Source organization:
World Bank staff estimates based on sources and methods in World Bank's "The Changing Wealth of Nations: Measuring Sustainable Development in the New Millennium" (2011).
Categories, topics:
Economy & Growth
Last updated:
apr 23, 2017
Indicators value changes by year
Minimum:
-41.604
jan 1, 1984
Maximum:
17.833
jan 1, 1985
At the date of observation
Value
Absolute change
Change from previous value
jan 1, 1984
-41.604
-41.604
0.0%
jan 1, 1985
17.833
+59.436
-142.86%
jan 1, 1986
6.666
-11.166
-62.62%
jan 1, 1987
10.29
+3.624
54.36%
jan 1, 1988
3.234
-7.056
-68.57%
jan 1, 1989
-0.667
-3.901
-120.63%
jan 1, 1990
13.527
+14.195
-2.13K%
jan 1, 1991
-16.443
-29.97
-221.55%
jan 1, 1992
3.26
+19.703
-119.83%
jan 1, 1993
0.719
-2.541
-77.94%
jan 1, 1994
5.052
+4.333
602.36%
jan 1, 1995
4.567
-0.485
-9.59%
jan 1, 1996
6.054
+1.487
32.55%
jan 1, 1997
3.606
-2.448
-40.44%
jan 1, 1998
3.346
-0.26
-7.21%
jan 1, 1999
-1.756
-5.101
-152.48%
jan 1, 2000
-3.903
-2.147
122.3%
jan 1, 2001
4.736
+8.639
-221.33%
jan 1, 2002
0.666
-4.07
-85.95%
jan 1, 2003
3.302
+2.636
396.09%
jan 1, 2004
0.705
-2.597
-78.66%
jan 1, 2005
7.706
+7.001
993.37%
jan 1, 2006
2.05
-5.656
-73.4%
jan 1, 2007
4.672
+2.622
127.91%
jan 1, 2008
6.317
+1.645
35.21%
jan 1, 2009
4.689
-1.629
-25.78%
jan 1, 2010
1.371
-3.318
-70.76%
jan 1, 2011
14.25
+12.879
939.23%
jan 1, 2012
4.432
-9.818
-68.9%
jan 1, 2013
-0.569
-5.001
-112.84%
jan 1, 2014
1.469
+2.038
-358.12%
jan 1, 2015
2.847
+1.378
93.83%
Ranking of countries by current statistics by years


Comments: