29
/
en
AIzaSyAYiBZKx7MnpbEhh9jyipgxe19OcubqV5w
April 1, 2024
133790
France
FRA
true
2
1
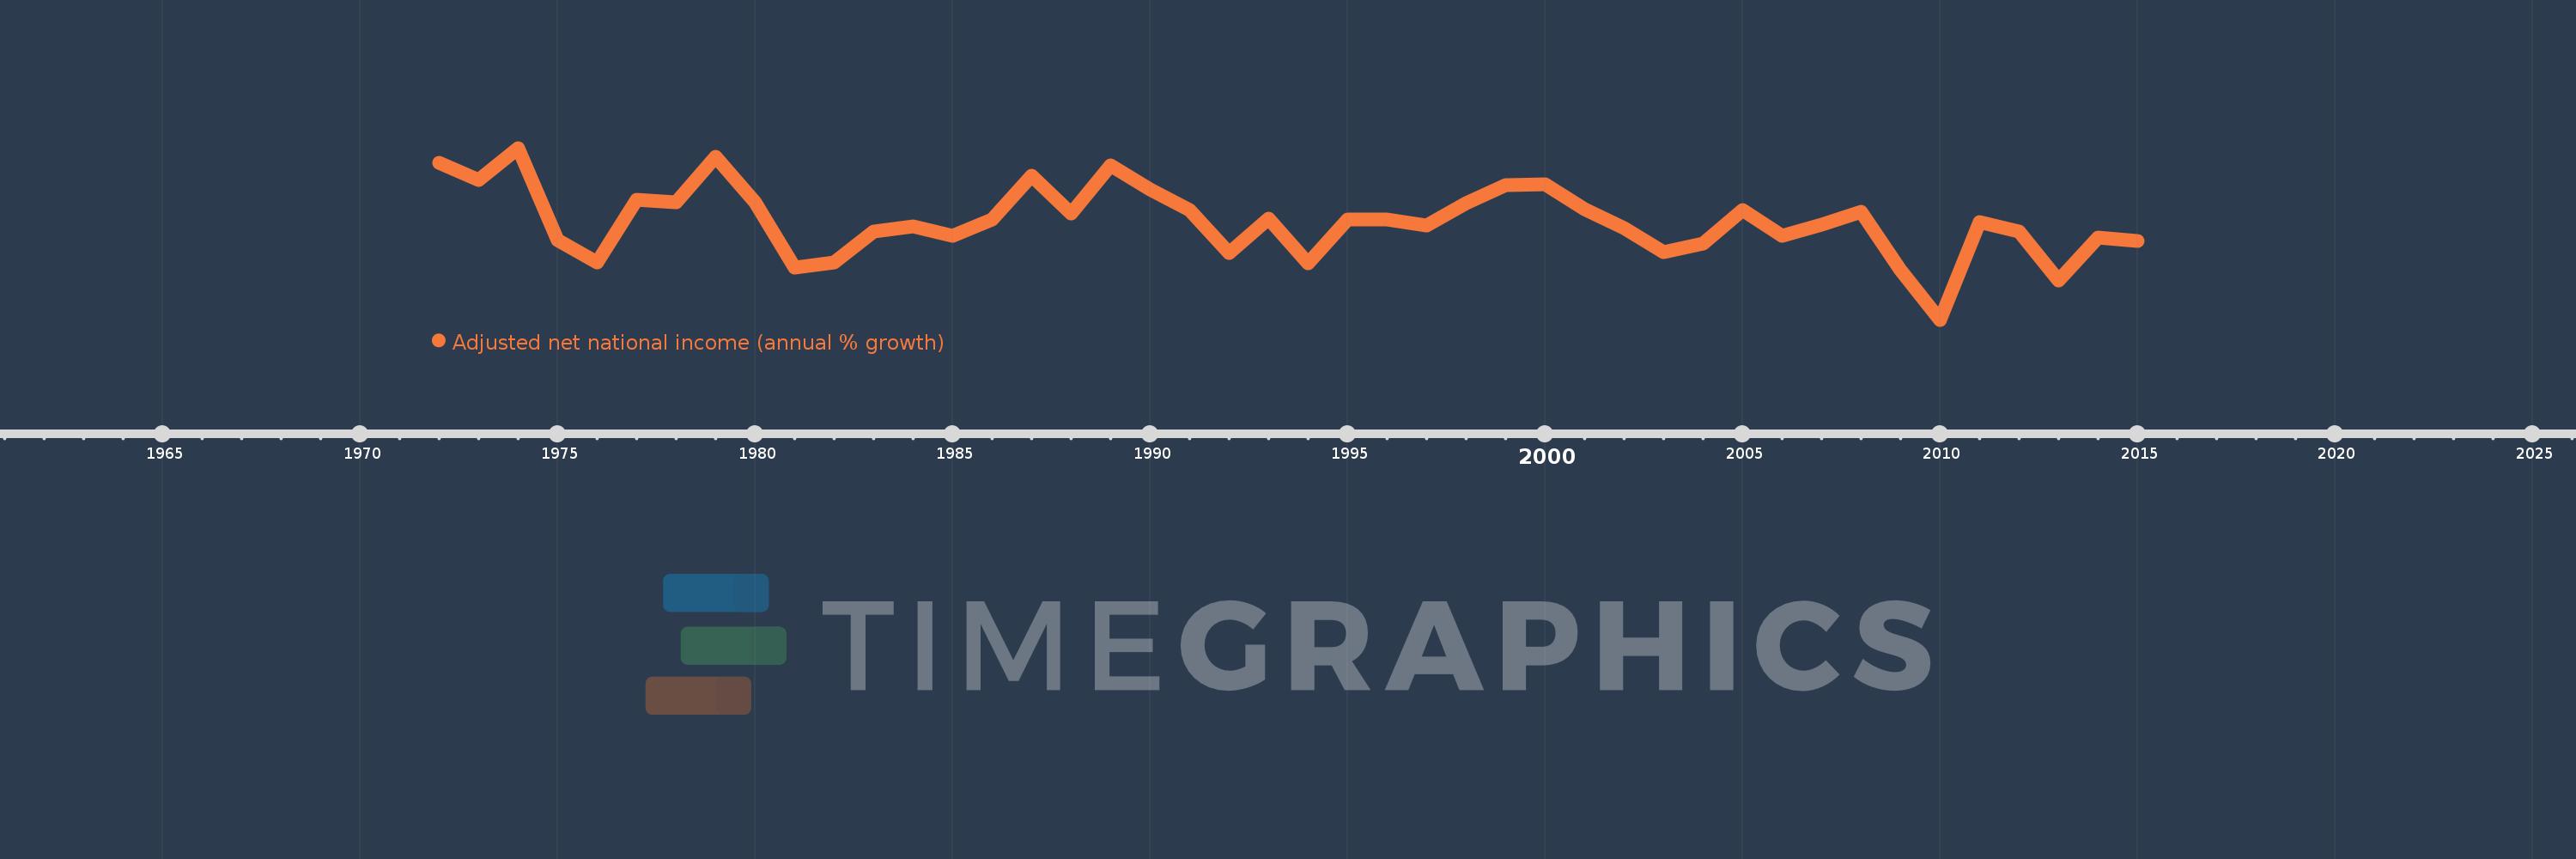
Adjusted net national income (annual % growth)
2015,2014,2013,2012,2011,2010,2009,2008,2007,2006,2005,2004,2003,2002,2001,2000,1999,1998,1997,1996,1995,1994,1993,1992,1991,1990,1989,1988,1987,1986,1985,1984,1983,1982,1981,1980,1979,1978,1977,1976,1975,1974,1973,1972
This statistics in other country:
Timeline:
This timeline shows a graph from 1972 to 2015 of France. No data until 1971. Number of actual observations by date: 44.
Source name:
World Development Indicators
Source organization:
World Bank staff estimates based on sources and methods in World Bank's "The Changing Wealth of Nations: Measuring Sustainable Development in the New Millennium" (2011).
Categories, topics:
Economy & Growth
Last updated:
apr 23, 2017
Indicators value changes by year
Minimum:
-3.419
jan 1, 2010
At the date of observation
Value
Absolute change
Change from previous value
jan 1, 1972
5.357
+5.357
0.0%
jan 1, 1973
4.384
-0.972
-18.15%
jan 1, 1974
6.181
+1.797
40.98%
jan 1, 1975
1.019
-5.162
-83.51%
jan 1, 1976
-0.204
-1.224
-120.06%
jan 1, 1977
3.271
+3.475
-1.7K%
jan 1, 1978
3.14
-0.131
-4.02%
jan 1, 1979
5.707
+2.567
81.77%
jan 1, 1980
3.161
-2.545
-44.61%
jan 1, 1981
-0.501
-3.662
-115.85%
jan 1, 1982
-0.212
+0.289
-57.63%
jan 1, 1983
1.512
+1.725
-812.17%
jan 1, 1984
1.803
+0.29
19.19%
jan 1, 1985
1.285
-0.517
-28.69%
jan 1, 1986
2.194
+0.909
70.72%
jan 1, 1987
4.638
+2.444
111.36%
jan 1, 1988
2.518
-2.121
-45.72%
jan 1, 1989
5.228
+2.711
107.69%
jan 1, 1990
3.849
-1.38
-26.39%
jan 1, 1991
2.734
-1.115
-28.97%
jan 1, 1992
0.304
-2.429
-88.87%
jan 1, 1993
2.208
+1.904
625.49%
jan 1, 1994
-0.284
-2.492
-112.85%
jan 1, 1995
2.204
+2.488
-877.12%
jan 1, 1996
2.18
-0.025
-1.12%
jan 1, 1997
1.827
-0.353
-16.19%
jan 1, 1998
3.091
+1.265
69.24%
jan 1, 1999
4.115
+1.023
33.11%
jan 1, 2000
4.154
+0.039
0.95%
jan 1, 2001
2.747
-1.407
-33.87%
jan 1, 2002
1.683
-1.065
-38.75%
jan 1, 2003
0.382
-1.301
-77.29%
jan 1, 2004
0.817
+0.434
113.62%
jan 1, 2005
2.705
+1.888
231.27%
jan 1, 2006
1.266
-1.439
-53.2%
jan 1, 2007
1.906
+0.64
50.55%
jan 1, 2008
2.625
+0.719
37.72%
jan 1, 2009
-0.64
-3.265
-124.39%
jan 1, 2010
-3.419
-2.778
433.93%
jan 1, 2011
2.042
+5.461
-159.73%
jan 1, 2012
1.507
-0.535
-26.22%
jan 1, 2013
-1.213
-2.719
-180.5%
jan 1, 2014
1.161
+2.374
-195.76%
jan 1, 2015
0.996
-0.165
-14.22%
Ranking of countries by current statistics by years


Comments: