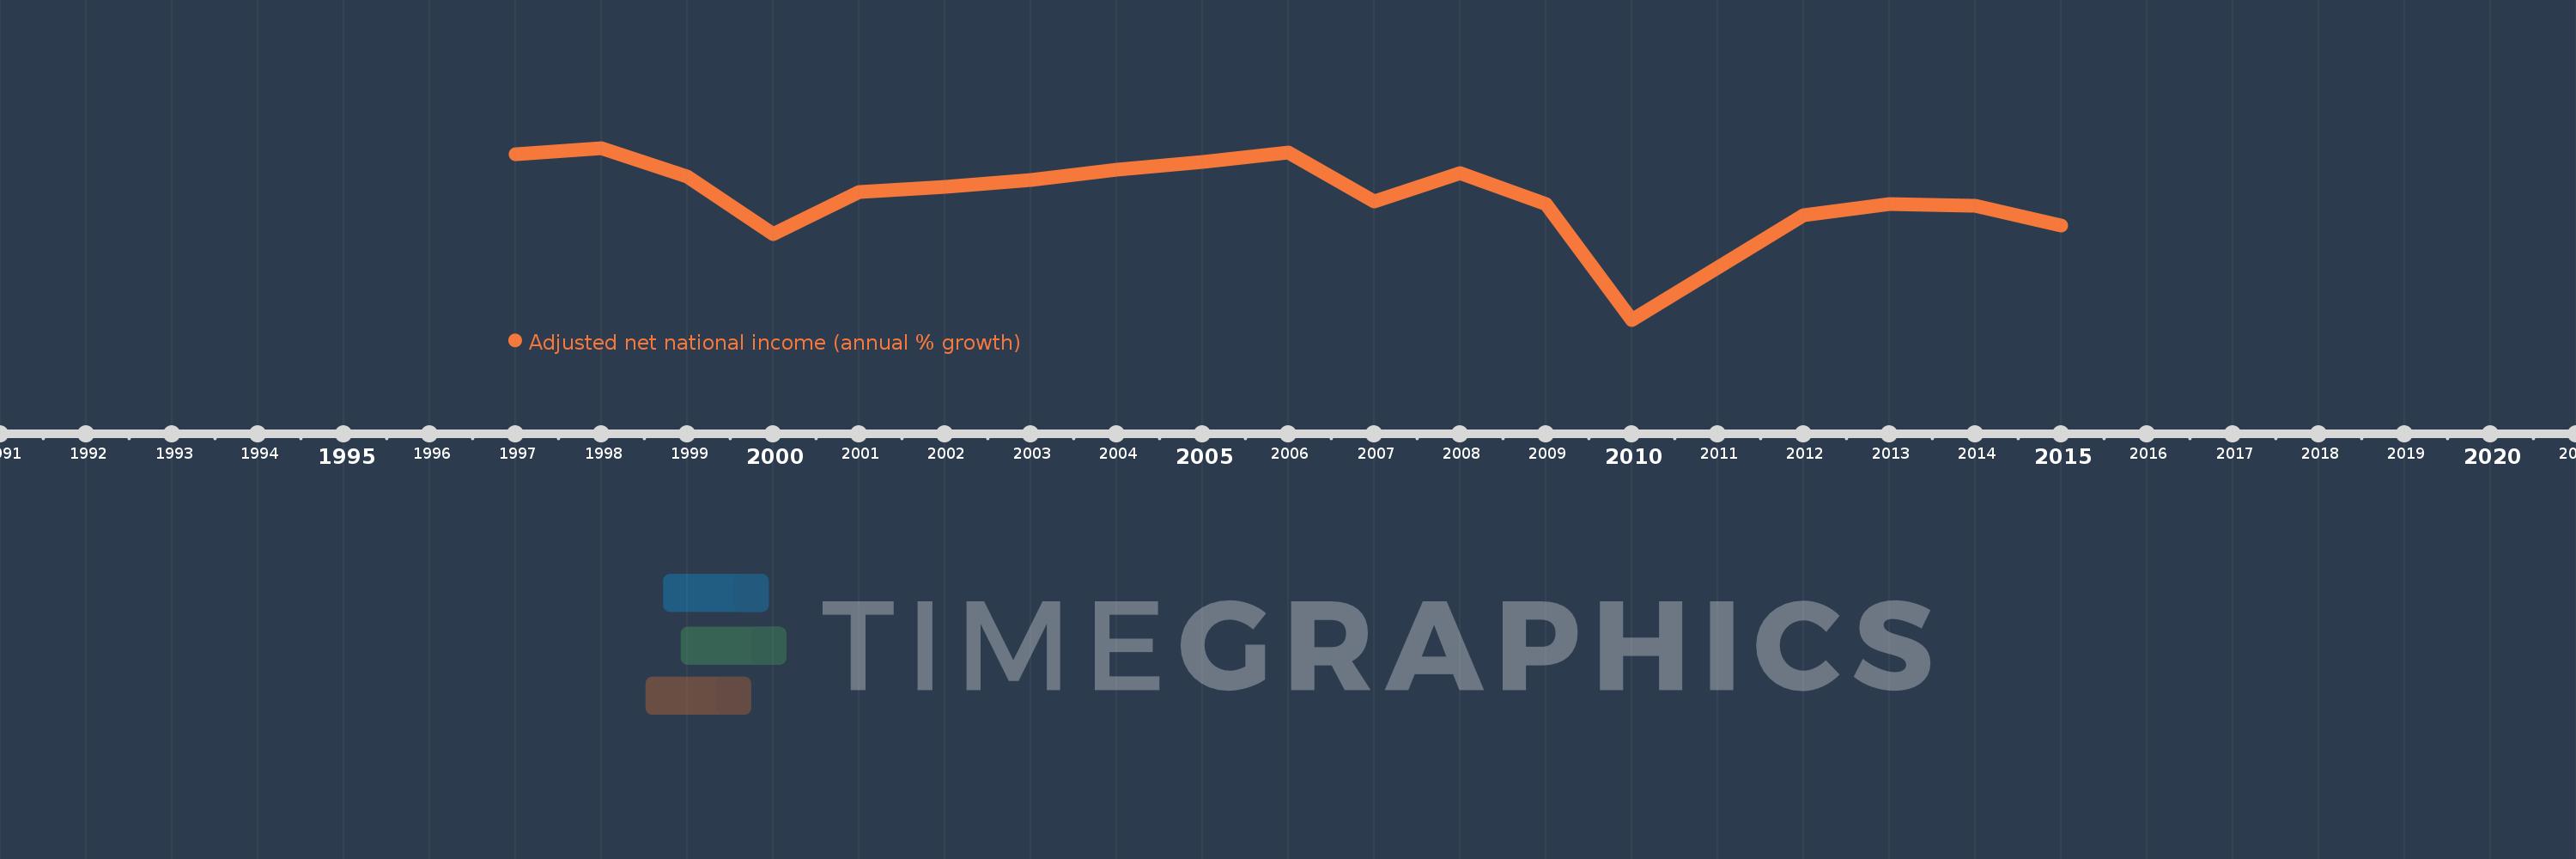
This timeline shows a graph from 1997 to 2015 of Lithuania. No data until 1996. Number of actual observations by date: 19.
Source name:
World Development Indicators
Source organization:
World Bank staff estimates based on sources and methods in World Bank's "The Changing Wealth of Nations: Measuring Sustainable Development in the New Millennium" (2011).
Categories, topics:
Economy & Growth
Last updated:
apr 23, 2017
Indicators value changes by year
Meaning:
5.561
Minimum:
-11.625
jan 1, 2010
Maximum:
12.724
jan 1, 1998
At the date of observation
Value
Absolute change
Change from the previous value
jan 1, 1997
11.799
+11.799
0.0%
jan 1, 1998
12.724
+0.924
7.83%
jan 1, 1999
8.639
-4.085
-32.11%
jan 1, 2000
0.546
-8.093
-93.68%
jan 1, 2001
6.497
+5.951
1.09K%
jan 1, 2002
7.267
+0.77
11.84%
jan 1, 2003
8.144
+0.877
12.07%
jan 1, 2004
9.68
+1.536
18.87%
jan 1, 2005
10.79
+1.11
11.47%
jan 1, 2006
12.064
+1.274
11.81%
jan 1, 2007
5.141
-6.923
-57.39%
jan 1, 2008
9.163
+4.022
78.23%
jan 1, 2009
4.791
-4.371
-47.71%
jan 1, 2010
-11.625
-16.417
-342.62%
jan 1, 2011
-4.192
+7.433
-63.94%
jan 1, 2012
3.155
+7.346
-175.25%
jan 1, 2013
4.806
+1.651
52.33%
jan 1, 2014
4.577
-0.228
-4.75%
jan 1, 2015
1.697
-2.881
-62.93%
Ranking of countries by current statistics by years
