29
/
en
AIzaSyAYiBZKx7MnpbEhh9jyipgxe19OcubqV5w
April 1, 2024
41183
Latin America & Caribbean
LCN
false
2
1
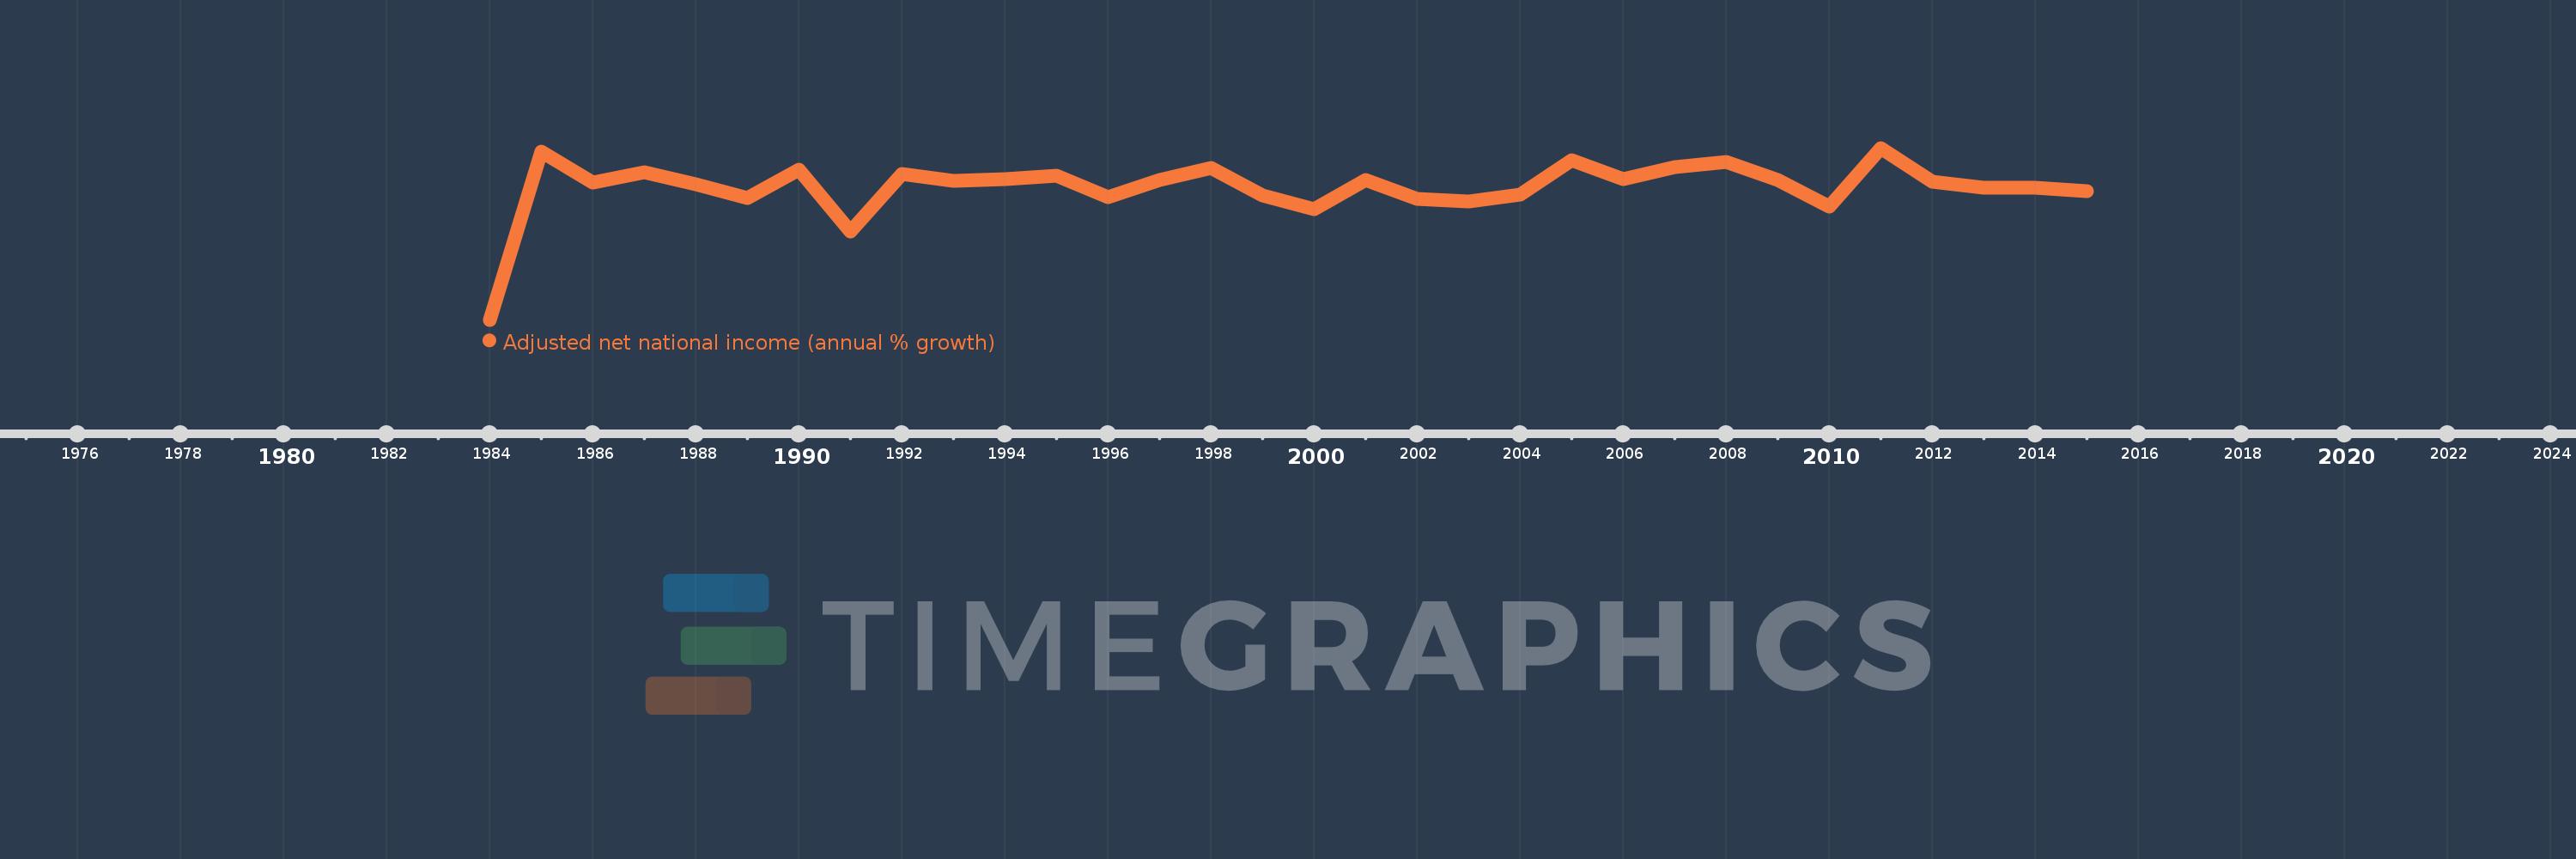
Adjusted net national income (annual % growth)
2015,2014,2013,2012,2011,2010,2009,2008,2007,2006,2005,2004,2003,2002,2001,2000,1999,1998,1997,1996,1995,1994,1993,1992,1991,1990,1989,1988,1987,1986,1985,1984
This statistics in other country:
Timeline:
This timeline shows a graph from 1984 to 2015 of Latin America & Caribbean . No data until 1983. Number of actual observations by date: 32.
Source name:
World Development Indicators
Source organization:
World Bank staff estimates based on sources and methods in World Bank's "The Changing Wealth of Nations: Measuring Sustainable Development in the New Millennium" (2011).
Categories, topics:
Economy & Growth
Last updated:
apr 23, 2017
Indicators value changes by year
Minimum:
-23.43
jan 1, 1984
At the date of observation
Value
Absolute change
Change from previous value
jan 1, 1984
-23.43
-23.43
0.0%
jan 1, 1985
9.647
+33.078
-141.18%
jan 1, 1986
3.58
-6.067
-62.89%
jan 1, 1987
5.586
+2.006
56.02%
jan 1, 1988
3.179
-2.407
-43.1%
jan 1, 1989
0.536
-2.643
-83.15%
jan 1, 1990
6.14
+5.604
1.05K%
jan 1, 1991
-6.119
-12.259
-199.66%
jan 1, 1992
5.254
+11.373
-185.86%
jan 1, 1993
3.955
-1.298
-24.71%
jan 1, 1994
4.267
+0.312
7.88%
jan 1, 1995
4.888
+0.621
14.56%
jan 1, 1996
0.735
-4.153
-84.96%
jan 1, 1997
4.094
+3.359
456.95%
jan 1, 1998
6.421
+2.327
56.84%
jan 1, 1999
1.071
-5.351
-83.32%
jan 1, 2000
-1.662
-2.733
-255.23%
jan 1, 2001
4.111
+5.774
-347.34%
jan 1, 2002
0.371
-3.741
-90.98%
jan 1, 2003
-0.247
-0.617
-166.49%
jan 1, 2004
1.134
+1.381
-560.0%
jan 1, 2005
8.003
+6.869
605.72%
jan 1, 2006
4.265
-3.738
-46.71%
jan 1, 2007
6.577
+2.312
54.22%
jan 1, 2008
7.51
+0.933
14.19%
jan 1, 2009
4.056
-3.454
-45.99%
jan 1, 2010
-1.17
-5.226
-128.84%
jan 1, 2011
10.34
+11.51
-984.01%
jan 1, 2012
3.742
-6.598
-63.81%
jan 1, 2013
2.582
-1.16
-31.01%
jan 1, 2014
2.459
-0.123
-4.75%
jan 1, 2015
1.839
-0.62
-25.23%
Ranking of countries by current statistics by years


Comments: