29
/
en
AIzaSyAYiBZKx7MnpbEhh9jyipgxe19OcubqV5w
April 1, 2024
219249
Papua New Guinea
PNG
true
2
1
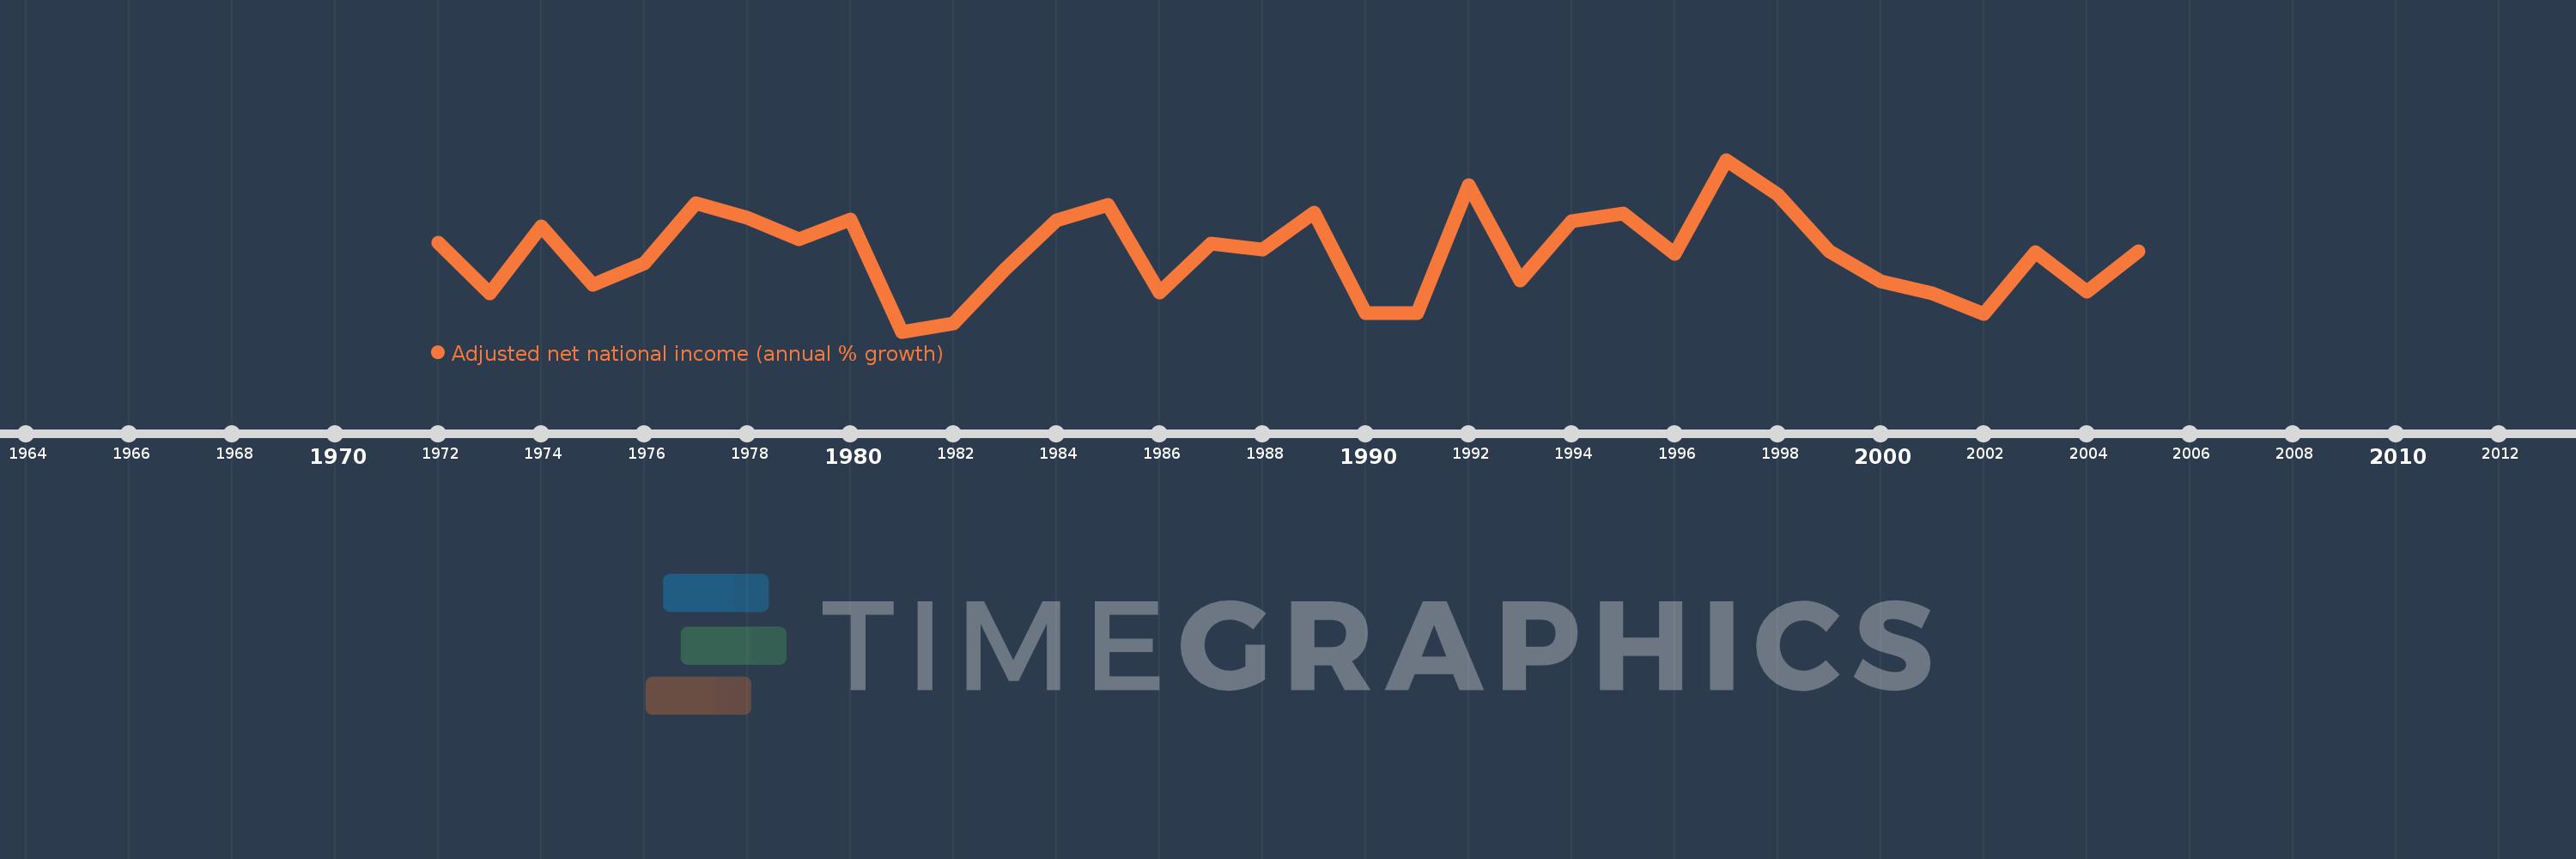
Adjusted net national income (annual % growth)
2005,2004,2003,2002,2001,2000,1999,1998,1997,1996,1995,1994,1993,1992,1991,1990,1989,1988,1987,1986,1985,1984,1983,1982,1981,1980,1979,1978,1977,1976,1975,1974,1973,1972
This statistics in other country:
Timeline:
This timeline shows a graph from 1972 to 2005 of Papua New Guinea. No data until 1971. Number of actual observations by date: 34.
Source name:
World Development Indicators
Source organization:
World Bank staff estimates based on sources and methods in World Bank's "The Changing Wealth of Nations: Measuring Sustainable Development in the New Millennium" (2011).
Categories, topics:
Economy & Growth
Last updated:
apr 23, 2017
Indicators value changes by year
Minimum:
-10.944
jan 1, 1981
Maximum:
14.375
jan 1, 1997
At the date of observation
Value
Absolute change
Change from previous value
jan 1, 1972
2.154
+2.154
0.0%
jan 1, 1973
-5.325
-7.479
-347.19%
jan 1, 1974
4.531
+9.856
-185.09%
jan 1, 1975
-4.044
-8.575
-189.26%
jan 1, 1976
-0.828
+3.216
-79.53%
jan 1, 1977
7.979
+8.807
-1.06K%
jan 1, 1978
5.779
-2.199
-27.56%
jan 1, 1979
2.626
-3.153
-54.56%
jan 1, 1980
5.639
+3.012
114.69%
jan 1, 1981
-10.944
-16.582
-294.09%
jan 1, 1982
-9.786
+1.158
-10.58%
jan 1, 1983
-1.78
+8.006
-81.81%
jan 1, 1984
5.415
+7.195
-404.23%
jan 1, 1985
7.681
+2.266
41.85%
jan 1, 1986
-5.229
-12.911
-168.08%
jan 1, 1987
2.023
+7.253
-138.69%
jan 1, 1988
1.173
-0.85
-42.0%
jan 1, 1989
6.562
+5.389
459.26%
jan 1, 1990
-8.262
-14.824
-225.9%
jan 1, 1991
-8.202
+0.059
-0.72%
jan 1, 1992
10.606
+18.809
-229.31%
jan 1, 1993
-3.436
-14.042
-132.39%
jan 1, 1994
5.363
+8.799
-256.1%
jan 1, 1995
6.49
+1.127
21.02%
jan 1, 1996
0.542
-5.949
-91.65%
jan 1, 1997
14.375
+13.833
2.55K%
jan 1, 1998
9.267
-5.108
-35.53%
jan 1, 1999
0.845
-8.422
-90.89%
jan 1, 2000
-3.49
-4.334
-513.19%
jan 1, 2001
-5.294
-1.804
51.7%
jan 1, 2002
-8.401
-3.107
58.7%
jan 1, 2003
0.827
+9.228
-109.85%
jan 1, 2004
-5.049
-5.876
-710.38%
jan 1, 2005
0.889
+5.938
-117.61%
Ranking of countries by current statistics by years


Comments: