29
/
en
AIzaSyAYiBZKx7MnpbEhh9jyipgxe19OcubqV5w
April 1, 2024
224501
Poland
POL
true
2
1
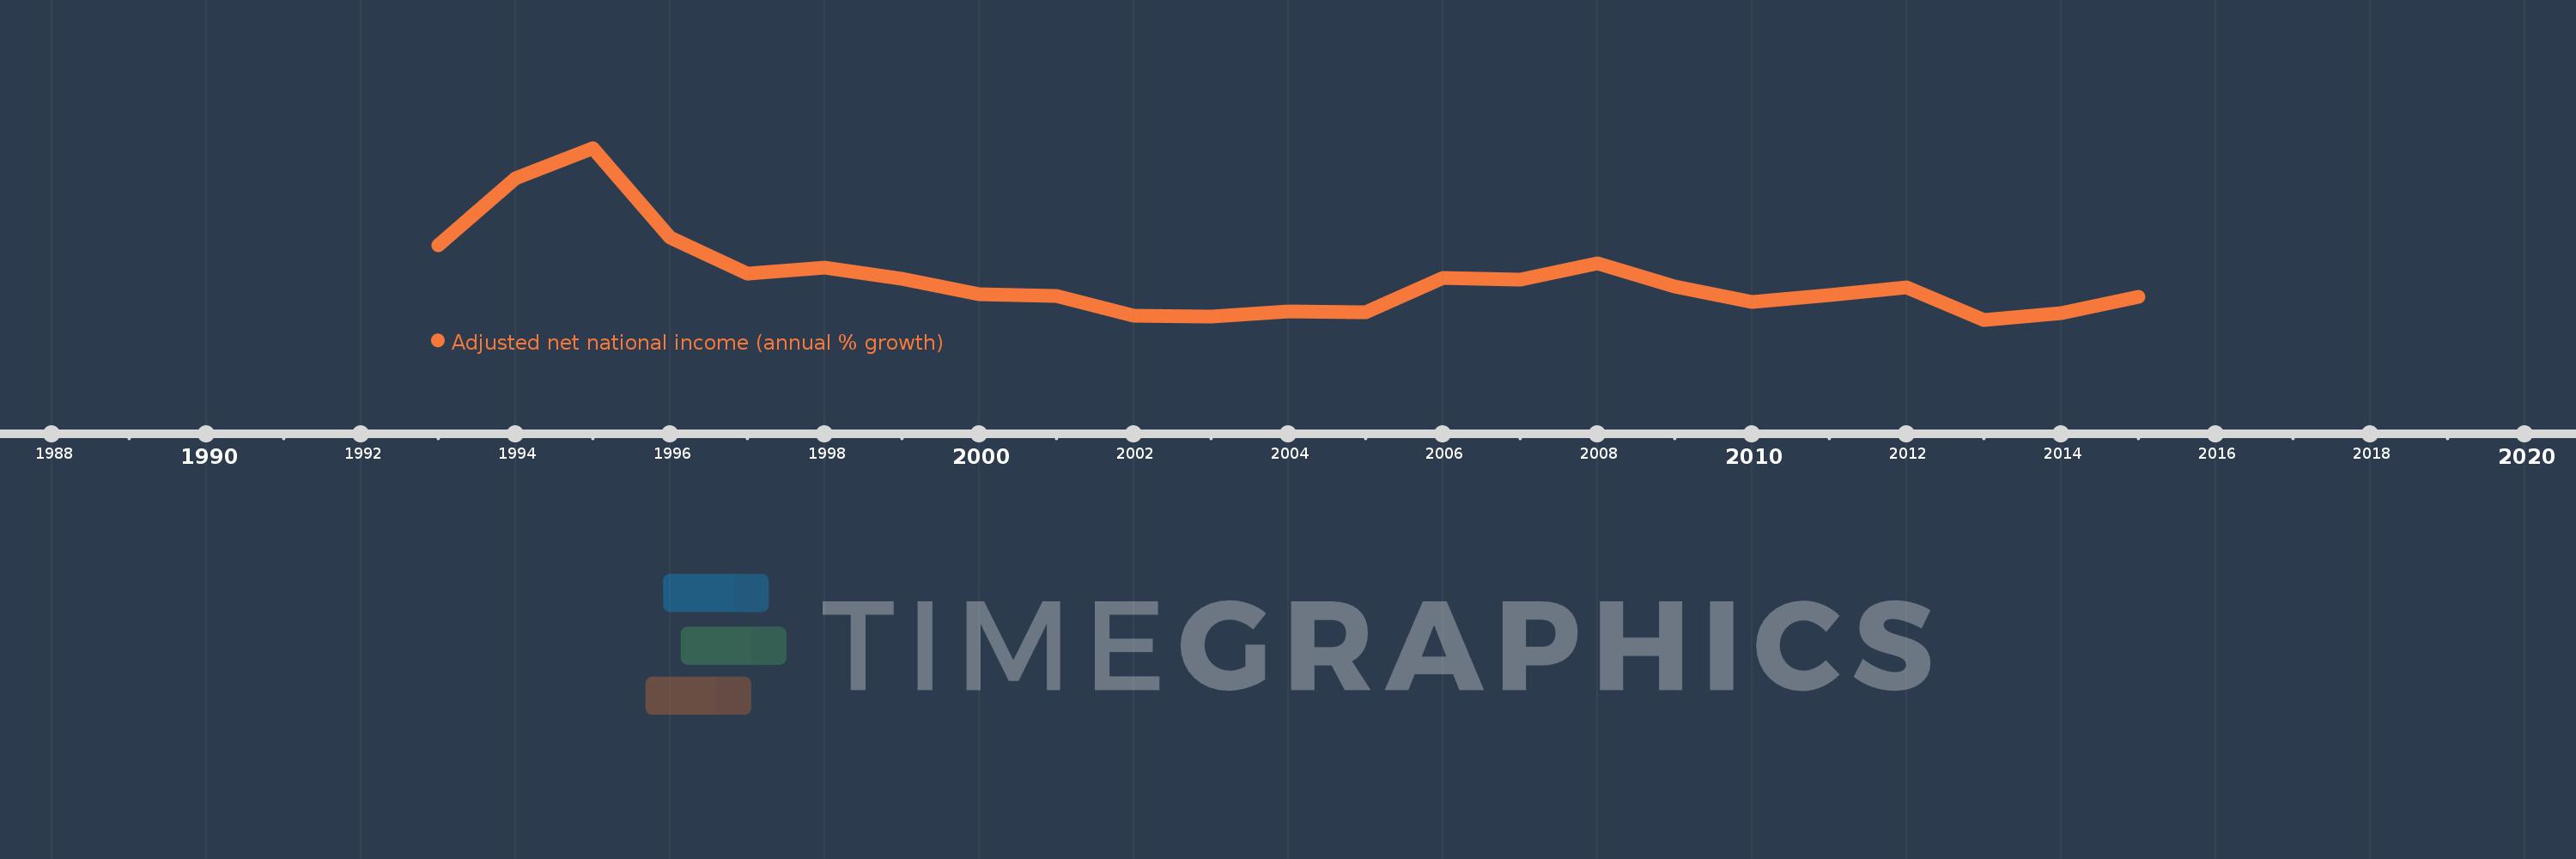
Adjusted net national income (annual % growth)
2015,2014,2013,2012,2011,2010,2009,2008,2007,2006,2005,2004,2003,2002,2001,2000,1999,1998,1997,1996,1995,1994,1993
This statistics in other country:
Timeline:
This timeline shows a graph from 1993 to 2015 of Poland. No data until 1992. Number of actual observations by date: 23.
Source name:
World Development Indicators
Source organization:
World Bank staff estimates based on sources and methods in World Bank's "The Changing Wealth of Nations: Measuring Sustainable Development in the New Millennium" (2011).
Categories, topics:
Economy & Growth
Last updated:
apr 23, 2017
Indicators value changes by year
Maximum:
22.043
jan 1, 1995
At the date of observation
Value
Absolute change
Change from previous value
jan 1, 1993
10.107
+10.107
0.0%
jan 1, 1994
18.336
+8.229
81.42%
jan 1, 1995
22.043
+3.707
20.22%
jan 1, 1996
11.03
-11.013
-49.96%
jan 1, 1997
6.579
-4.451
-40.35%
jan 1, 1998
7.368
+0.789
11.99%
jan 1, 1999
5.938
-1.43
-19.4%
jan 1, 2000
4.056
-1.882
-31.7%
jan 1, 2001
3.84
-0.216
-5.33%
jan 1, 2002
1.423
-2.417
-62.95%
jan 1, 2003
1.357
-0.066
-4.62%
jan 1, 2004
1.933
+0.576
42.46%
jan 1, 2005
1.907
-0.026
-1.37%
jan 1, 2006
6.101
+4.195
220.01%
jan 1, 2007
5.875
-0.227
-3.71%
jan 1, 2008
7.907
+2.032
34.6%
jan 1, 2009
5.029
-2.878
-36.4%
jan 1, 2010
3.154
-1.875
-37.28%
jan 1, 2011
3.93
+0.776
24.6%
jan 1, 2012
4.865
+0.934
23.78%
jan 1, 2013
0.939
-3.926
-80.7%
jan 1, 2014
1.707
+0.768
81.82%
jan 1, 2015
3.763
+2.056
120.45%
Ranking of countries by current statistics by years


Comments: