29
/
en
AIzaSyAYiBZKx7MnpbEhh9jyipgxe19OcubqV5w
April 1, 2024
212547
Nigeria
NGA
true
2
1
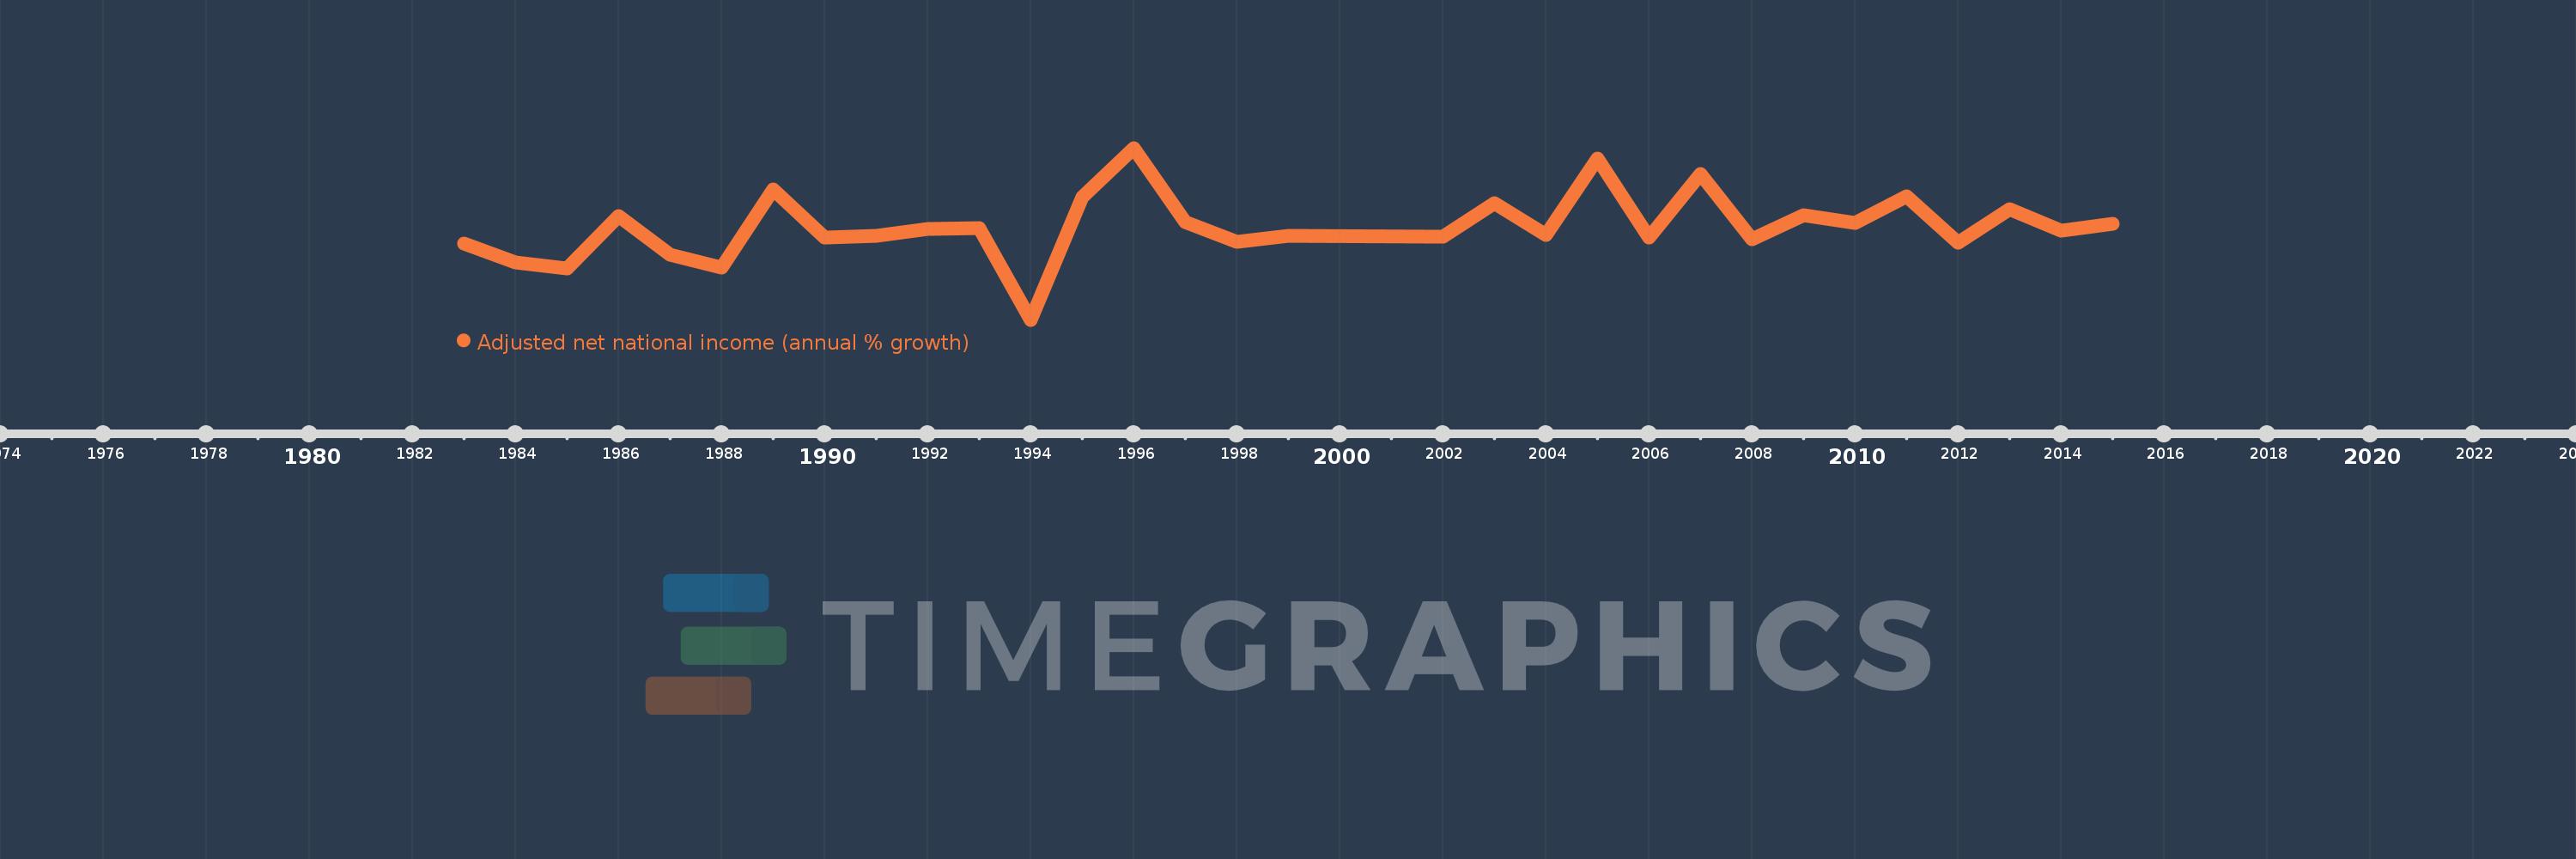
Adjusted net national income (annual % growth)
2015,2014,2013,2012,2011,2010,2009,2008,2007,2006,2005,2004,2003,2002,1999,1998,1997,1996,1995,1994,1993,1992,1991,1990,1989,1988,1987,1986,1985,1984,1983
This statistics in other country:
Timeline:
This timeline shows a graph from 1983 to 2015 of Nigeria. No data until 1982. Number of actual observations by date: 31.
Source name:
World Development Indicators
Source organization:
World Bank staff estimates based on sources and methods in World Bank's "The Changing Wealth of Nations: Measuring Sustainable Development in the New Millennium" (2011).
Categories, topics:
Economy & Growth
Last updated:
apr 23, 2017
Indicators value changes by year
Minimum:
-42.303
jan 1, 1994
Maximum:
44.478
jan 1, 1996
At the date of observation
Value
Absolute change
Change from previous value
jan 1, 1983
-3.9
-3.9
0.0%
jan 1, 1984
-13.343
-9.443
242.1%
jan 1, 1985
-16.235
-2.891
21.67%
jan 1, 1986
10.274
+26.508
-163.28%
jan 1, 1987
-9.558
-19.832
-193.04%
jan 1, 1988
-16.128
-6.57
68.74%
jan 1, 1989
23.644
+39.772
-246.6%
jan 1, 1990
-0.744
-24.388
-103.15%
jan 1, 1991
0.126
+0.87
-116.99%
jan 1, 1992
3.348
+3.222
2.55K%
jan 1, 1993
3.924
+0.576
17.21%
jan 1, 1994
-42.303
-46.227
-1.18K%
jan 1, 1995
19.511
+61.813
-146.12%
jan 1, 1996
44.478
+24.967
127.97%
jan 1, 1997
7.075
-37.403
-84.09%
jan 1, 1998
-3.092
-10.167
-143.7%
jan 1, 1999
-0.071
+3.021
-97.7%
jan 1, 2002
-0.222
-0.151
212.73%
jan 1, 2003
16.363
+16.586
-7.47K%
jan 1, 2004
0.509
-15.854
-96.89%
jan 1, 2005
39.02
+38.511
7.57K%
jan 1, 2006
-0.712
-39.732
-101.82%
jan 1, 2007
31.338
+32.05
-4.5K%
jan 1, 2008
-1.488
-32.826
-104.75%
jan 1, 2009
10.474
+11.962
-804.09%
jan 1, 2010
6.452
-4.022
-38.4%
jan 1, 2011
20.237
+13.785
213.64%
jan 1, 2012
-3.549
-23.786
-117.54%
jan 1, 2013
13.688
+17.236
-485.71%
jan 1, 2014
2.612
-11.075
-80.91%
jan 1, 2015
5.997
+3.385
129.56%
Ranking of countries by current statistics by years


Comments: