29
/
en
AIzaSyAYiBZKx7MnpbEhh9jyipgxe19OcubqV5w
April 1, 2024
286775
Zimbabwe
ZWE
true
2
1
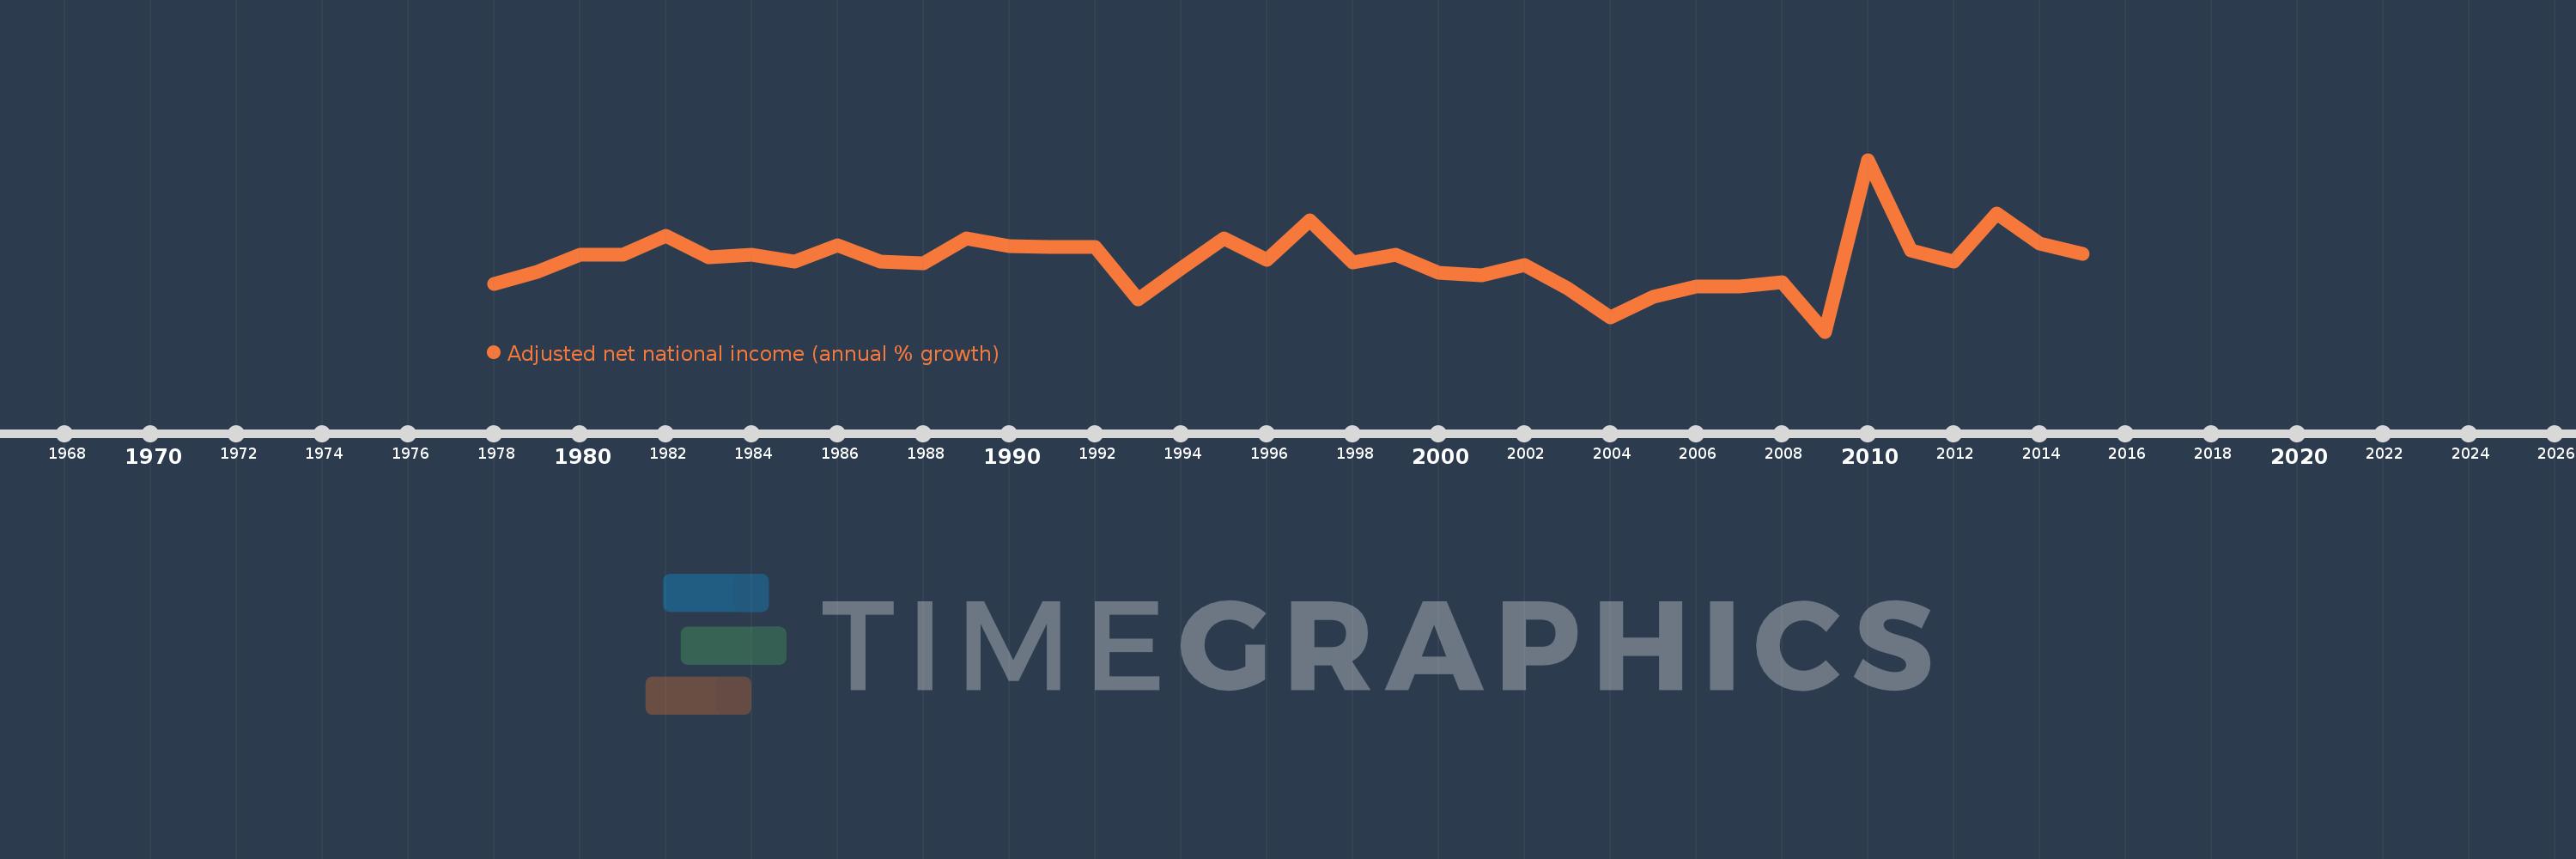
Adjusted net national income (annual % growth)
2015,2014,2013,2012,2011,2010,2009,2008,2007,2006,2005,2004,2003,2002,2001,2000,1999,1998,1997,1996,1995,1994,1993,1992,1991,1990,1989,1988,1987,1986,1985,1984,1983,1982,1981,1980,1979,1978
This statistics in other country:
Timeline:
This timeline shows a graph from 1978 to 2015 of Zimbabwe. No data until 1977. Number of actual observations by date: 38.
Source name:
World Development Indicators
Source organization:
World Bank staff estimates based on sources and methods in World Bank's "The Changing Wealth of Nations: Measuring Sustainable Development in the New Millennium" (2011).
Categories, topics:
Economy & Growth
Last updated:
apr 23, 2017
Indicators value changes by year
Minimum:
-23.605
jan 1, 2009
Maximum:
37.694
jan 1, 2010
At the date of observation
Value
Absolute change
Change from previous value
jan 1, 1978
-6.696
-6.696
0.0%
jan 1, 1979
-2.433
+4.263
-63.67%
jan 1, 1980
3.894
+6.327
-260.08%
jan 1, 1981
3.79
-0.104
-2.68%
jan 1, 1982
10.45
+6.659
175.7%
jan 1, 1983
3.022
-7.428
-71.08%
jan 1, 1984
3.93
+0.909
30.08%
jan 1, 1985
1.493
-2.438
-62.02%
jan 1, 1986
7.052
+5.559
372.33%
jan 1, 1987
1.406
-5.646
-80.06%
jan 1, 1988
0.891
-0.515
-36.62%
jan 1, 1989
9.662
+8.771
984.22%
jan 1, 1990
6.74
-2.923
-30.25%
jan 1, 1991
6.492
-0.247
-3.67%
jan 1, 1992
6.586
+0.094
1.45%
jan 1, 1993
-11.972
-18.558
-281.76%
jan 1, 1994
-0.945
+11.027
-92.11%
jan 1, 1995
9.523
+10.467
-1.11K%
jan 1, 1996
2.064
-7.459
-78.33%
jan 1, 1997
15.977
+13.914
674.14%
jan 1, 1998
1.206
-14.771
-92.45%
jan 1, 1999
3.927
+2.721
225.57%
jan 1, 2000
-2.494
-6.421
-163.5%
jan 1, 2001
-3.377
-0.884
35.43%
jan 1, 2002
0.211
+3.588
-106.25%
jan 1, 2003
-8.19
-8.401
-3.98K%
jan 1, 2004
-18.682
-10.492
128.11%
jan 1, 2005
-11.291
+7.391
-39.56%
jan 1, 2006
-7.42
+3.872
-34.29%
jan 1, 2007
-7.524
-0.104
1.4%
jan 1, 2008
-6.088
+1.435
-19.08%
jan 1, 2009
-23.605
-17.516
287.7%
jan 1, 2010
37.694
+61.298
-259.69%
jan 1, 2011
5.343
-32.35
-85.82%
jan 1, 2012
1.357
-3.986
-74.6%
jan 1, 2013
18.503
+17.146
1.26K%
jan 1, 2014
7.784
-10.719
-57.93%
jan 1, 2015
4.105
-3.679
-47.27%
Ranking of countries by current statistics by years


Comments: