29
/
en
AIzaSyAYiBZKx7MnpbEhh9jyipgxe19OcubqV5w
April 1, 2024
25452
Central Europe and the Baltics
CEB
false
2
1
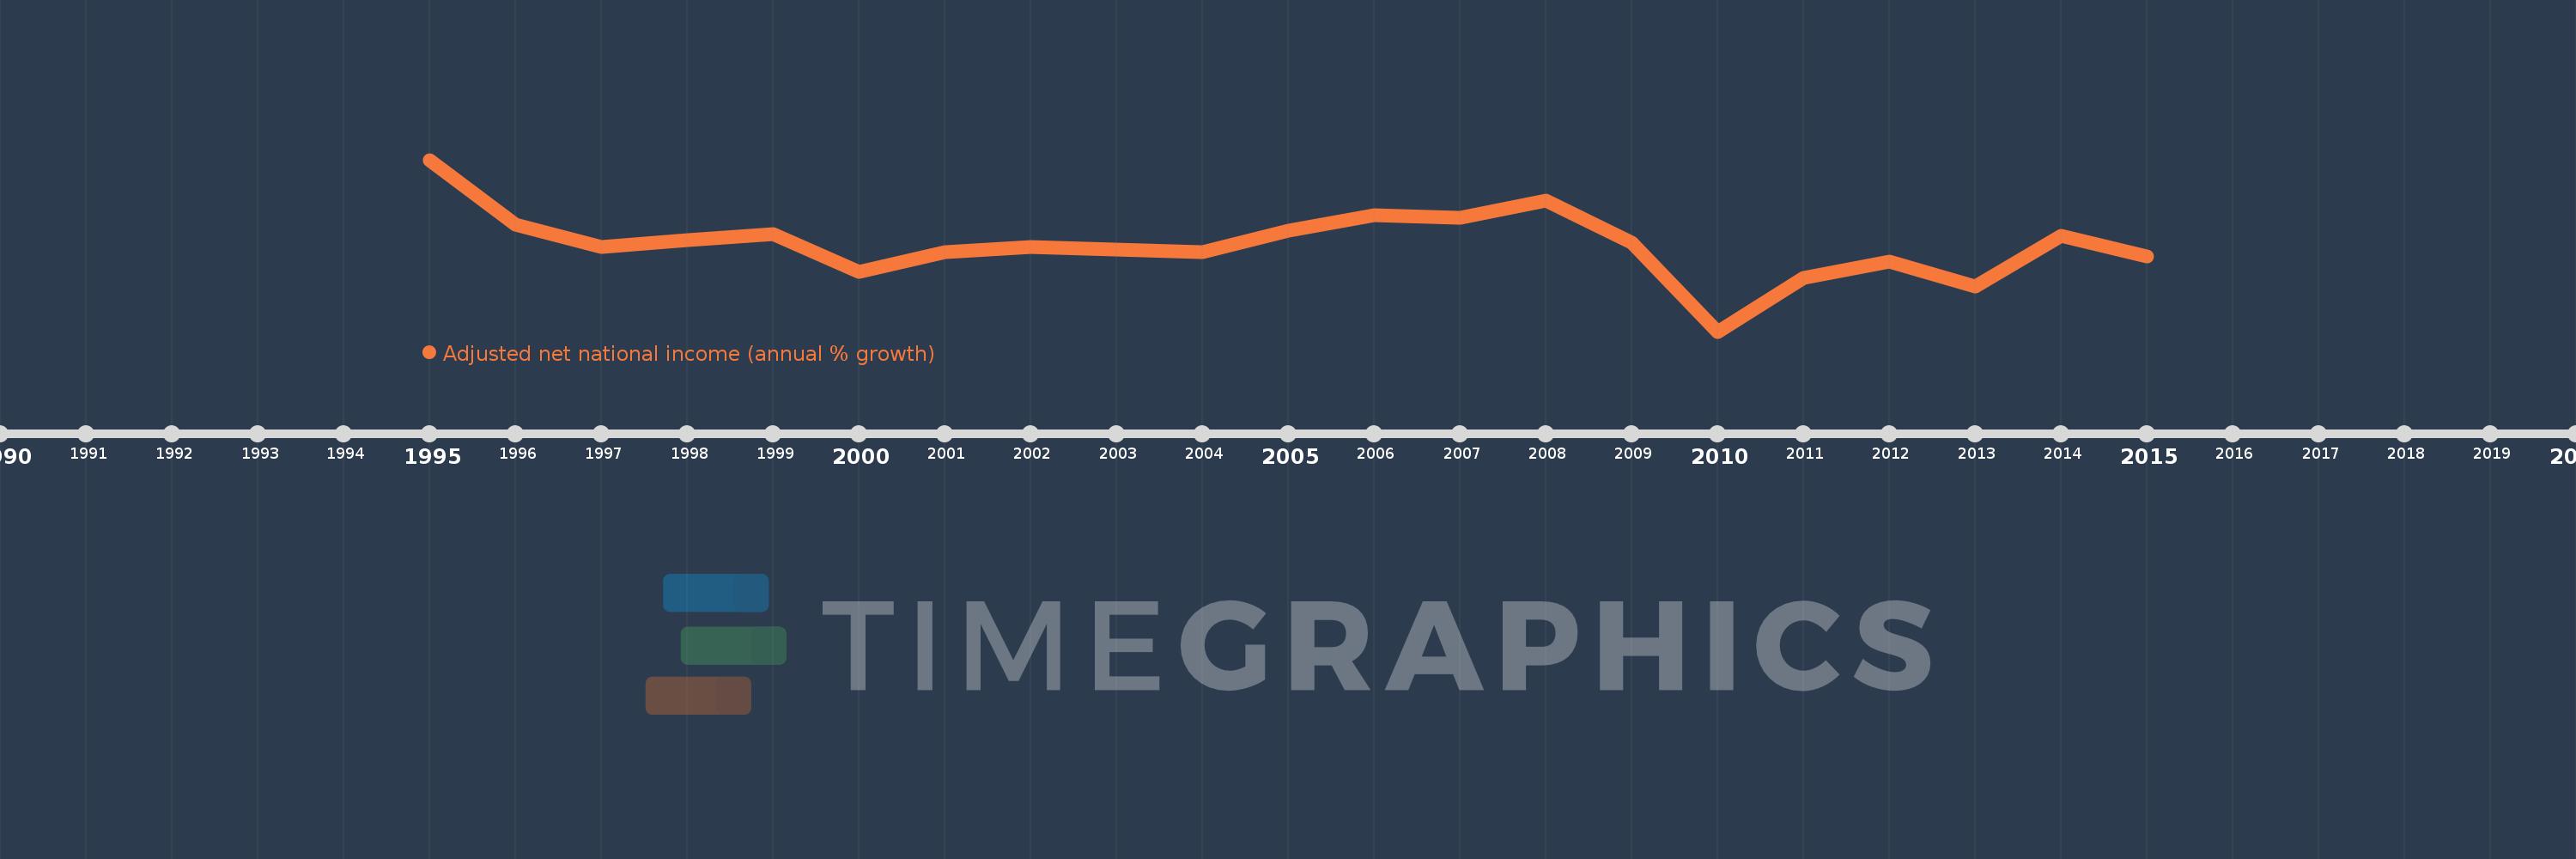
Adjusted net national income (annual % growth)
2015,2014,2013,2012,2011,2010,2009,2008,2007,2006,2005,2004,2003,2002,2001,2000,1999,1998,1997,1996,1995
This statistics in other country:
Timeline:
This timeline shows a graph from 1995 to 2015 of Central Europe and the Baltics. No data until 1994. Number of actual observations by date: 21.
Source name:
World Development Indicators
Source organization:
World Bank staff estimates based on sources and methods in World Bank's "The Changing Wealth of Nations: Measuring Sustainable Development in the New Millennium" (2011).
Categories, topics:
Economy & Growth
Last updated:
apr 23, 2017
Indicators value changes by year
Minimum:
-3.354
jan 1, 2010
Maximum:
11.144
jan 1, 1995
At the date of observation
Value
Absolute change
Change from previous value
jan 1, 1995
11.144
+11.144
0.0%
jan 1, 1996
5.64
-5.504
-49.39%
jan 1, 1997
3.763
-1.877
-33.29%
jan 1, 1998
4.339
+0.576
15.32%
jan 1, 1999
4.859
+0.52
11.99%
jan 1, 2000
1.696
-3.163
-65.09%
jan 1, 2001
3.377
+1.681
99.09%
jan 1, 2002
3.814
+0.437
12.93%
jan 1, 2003
3.549
-0.265
-6.95%
jan 1, 2004
3.386
-0.163
-4.6%
jan 1, 2005
5.142
+1.757
51.88%
jan 1, 2006
6.448
+1.305
25.38%
jan 1, 2007
6.287
-0.16
-2.49%
jan 1, 2008
7.693
+1.406
22.36%
jan 1, 2009
4.121
-3.572
-46.43%
jan 1, 2010
-3.354
-7.475
-181.39%
jan 1, 2011
1.159
+4.513
-134.55%
jan 1, 2012
2.573
+1.414
122.06%
jan 1, 2013
0.444
-2.129
-82.76%
jan 1, 2014
4.76
+4.316
972.95%
jan 1, 2015
3.005
-1.755
-36.86%
Ranking of countries by current statistics by years


Comments: