29
/
en
AIzaSyAYiBZKx7MnpbEhh9jyipgxe19OcubqV5w
April 1, 2024
106800
Colombia
COL
true
2
1
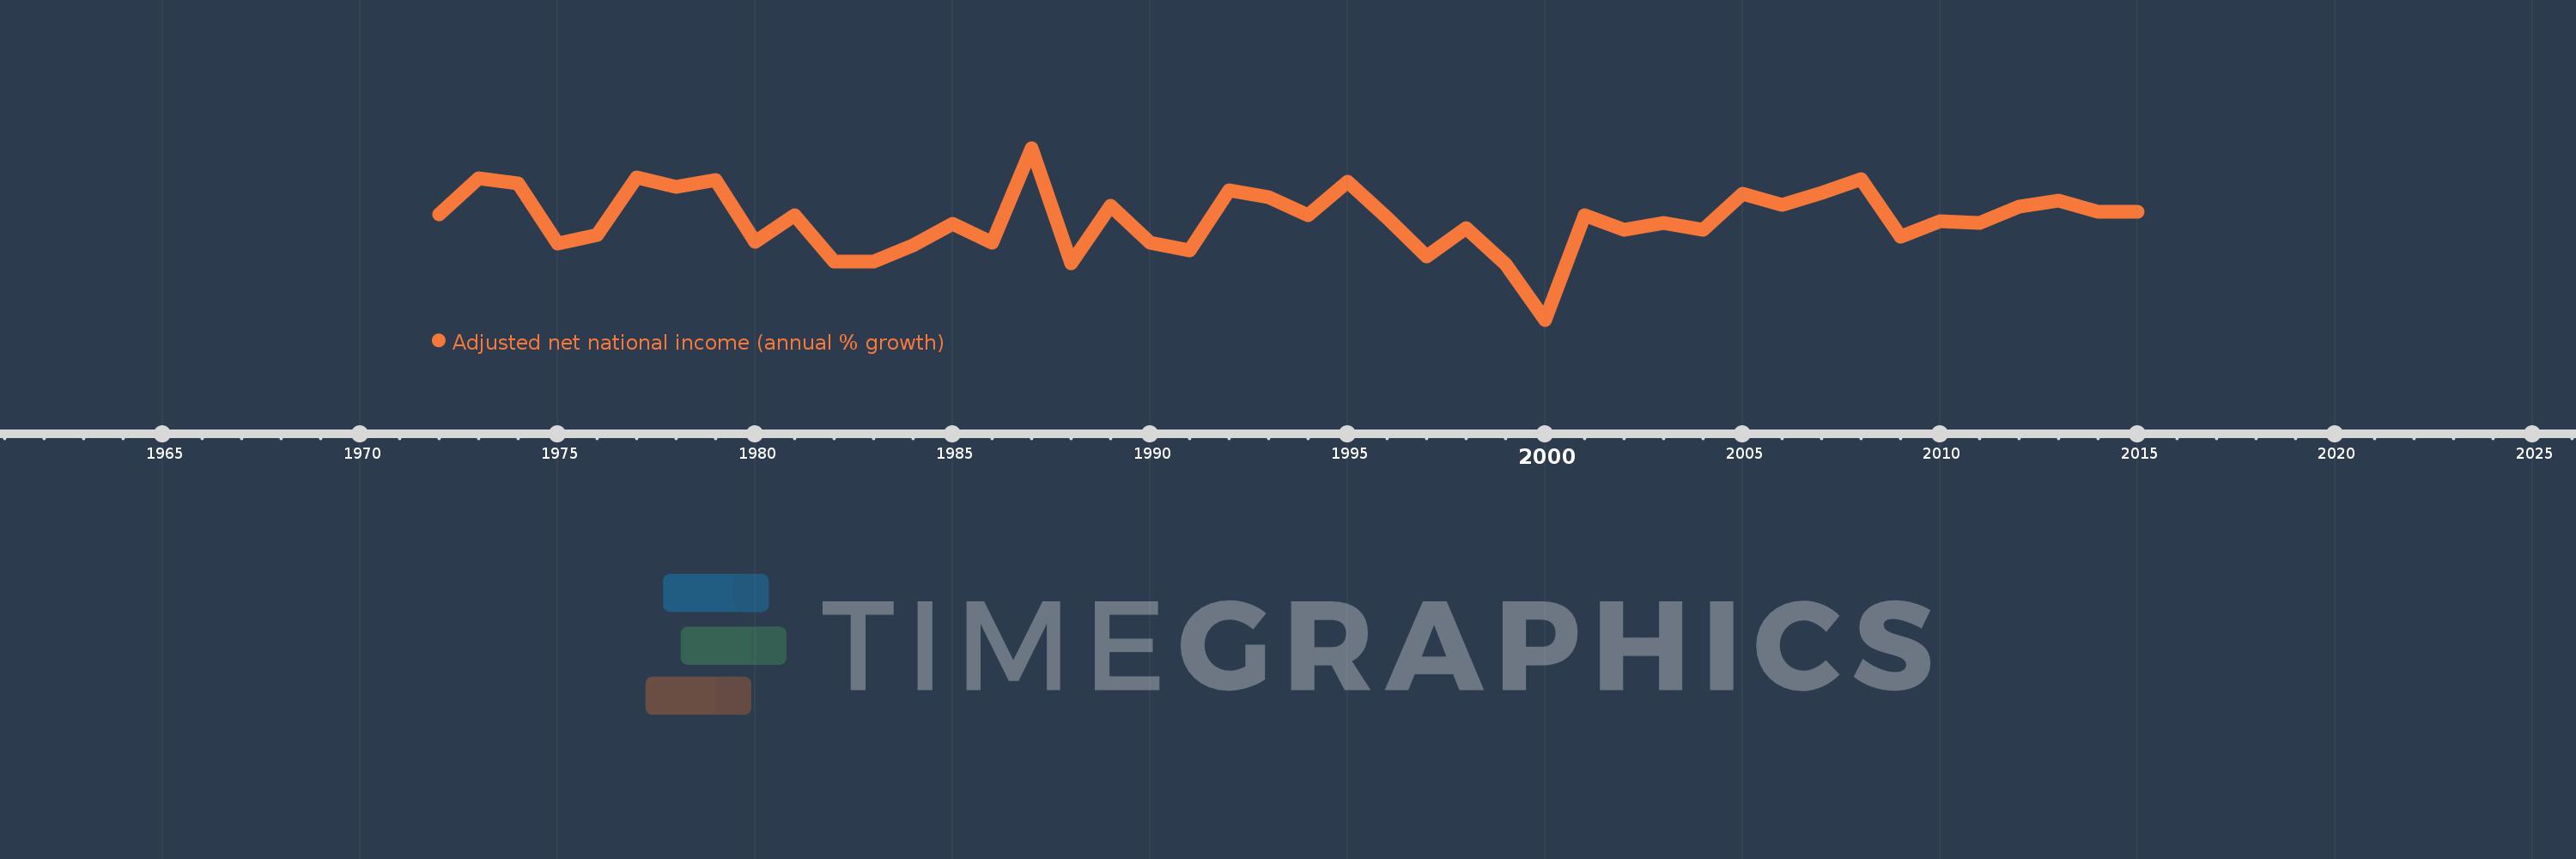
Adjusted net national income (annual % growth)
2015,2014,2013,2012,2011,2010,2009,2008,2007,2006,2005,2004,2003,2002,2001,2000,1999,1998,1997,1996,1995,1994,1993,1992,1991,1990,1989,1988,1987,1986,1985,1984,1983,1982,1981,1980,1979,1978,1977,1976,1975,1974,1973,1972
This statistics in other country:
Timeline:
This timeline shows a graph from 1972 to 2015 of Colombia. No data until 1971. Number of actual observations by date: 44.
Source name:
World Development Indicators
Source organization:
World Bank staff estimates based on sources and methods in World Bank's "The Changing Wealth of Nations: Measuring Sustainable Development in the New Millennium" (2011).
Categories, topics:
Economy & Growth
Last updated:
apr 23, 2017
Indicators value changes by year
Minimum:
-8.165
jan 1, 2000
Maximum:
12.782
jan 1, 1987
At the date of observation
Value
Absolute change
Change from previous value
jan 1, 1972
4.689
+4.689
0.0%
jan 1, 1973
9.13
+4.441
94.71%
jan 1, 1974
8.502
-0.628
-6.88%
jan 1, 1975
1.081
-7.422
-87.29%
jan 1, 1976
2.128
+1.047
96.92%
jan 1, 1977
9.175
+7.047
331.16%
jan 1, 1978
8.057
-1.119
-12.19%
jan 1, 1979
8.891
+0.835
10.36%
jan 1, 1980
1.322
-7.57
-85.13%
jan 1, 1981
4.602
+3.28
248.17%
jan 1, 1982
-1.113
-5.715
-124.19%
jan 1, 1983
-1.096
+0.017
-1.52%
jan 1, 1984
0.876
+1.972
-179.91%
jan 1, 1985
3.574
+2.698
307.94%
jan 1, 1986
1.189
-2.385
-66.73%
jan 1, 1987
12.782
+11.593
975.0%
jan 1, 1988
-1.263
-14.046
-109.88%
jan 1, 1989
5.694
+6.958
-550.75%
jan 1, 1990
1.185
-4.51
-79.2%
jan 1, 1991
0.301
-0.884
-74.6%
jan 1, 1992
7.606
+7.306
2.43K%
jan 1, 1993
6.829
-0.778
-10.22%
jan 1, 1994
4.586
-2.243
-32.84%
jan 1, 1995
8.621
+4.035
87.98%
jan 1, 1996
4.226
-4.396
-50.99%
jan 1, 1997
-0.459
-4.684
-110.86%
jan 1, 1998
3.042
+3.501
-763.19%
jan 1, 1999
-1.393
-4.436
-145.81%
jan 1, 2000
-8.165
-6.772
485.95%
jan 1, 2001
4.591
+12.756
-156.23%
jan 1, 2002
2.832
-1.759
-38.32%
jan 1, 2003
3.608
+0.776
27.41%
jan 1, 2004
2.754
-0.853
-23.65%
jan 1, 2005
7.225
+4.471
162.33%
jan 1, 2006
5.8
-1.426
-19.73%
jan 1, 2007
7.322
+1.522
26.25%
jan 1, 2008
8.998
+1.677
22.9%
jan 1, 2009
2.001
-6.998
-77.77%
jan 1, 2010
3.846
+1.846
92.26%
jan 1, 2011
3.612
-0.234
-6.1%
jan 1, 2012
5.619
+2.007
55.58%
jan 1, 2013
6.34
+0.721
12.83%
jan 1, 2014
5.007
-1.334
-21.04%
jan 1, 2015
5.023
+0.017
0.33%
Ranking of countries by current statistics by years


Comments: