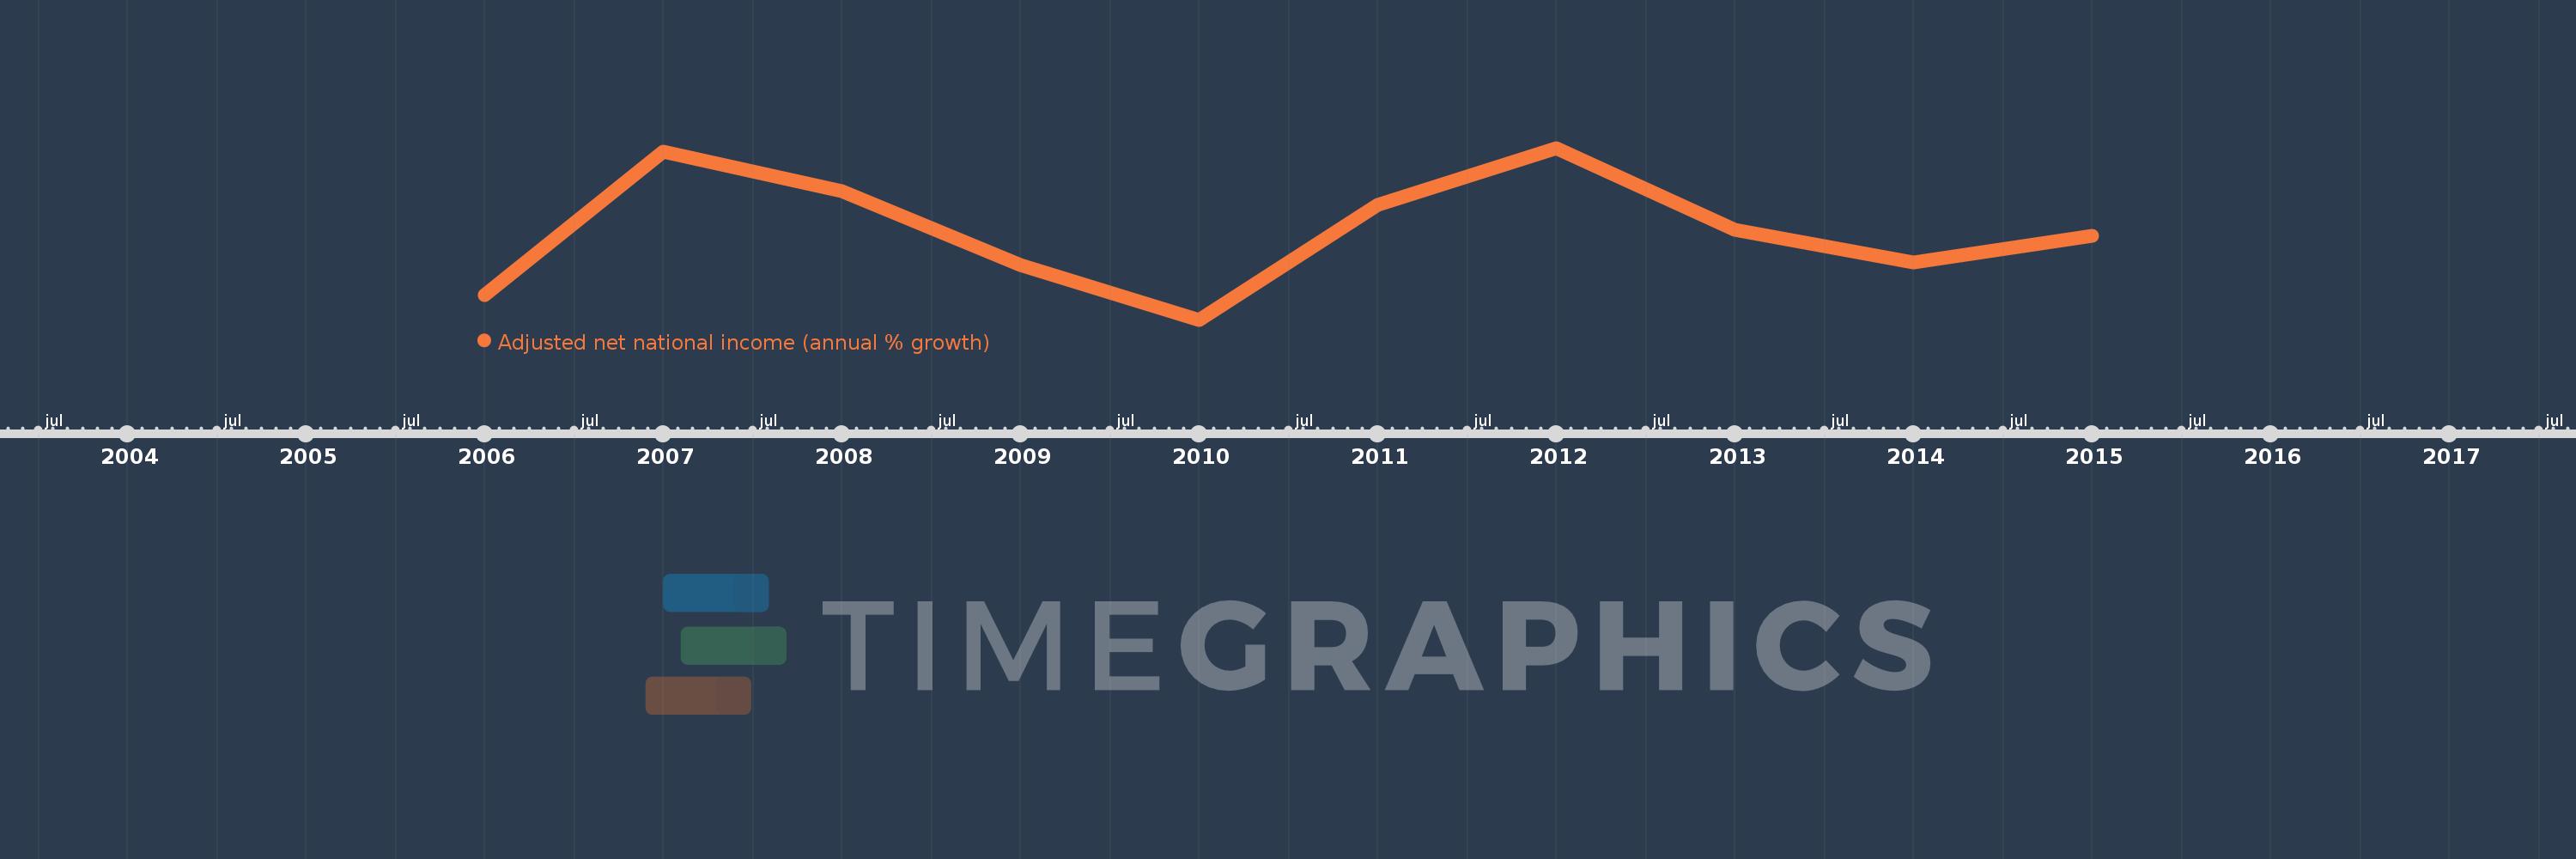
This timeline shows a graph from 2006 to 2015 of Small states. No data until 2005. Number of actual observations by date: 10.
Source name:
World Development Indicators
Source organization:
World Bank staff estimates based on sources and methods in World Bank's "The Changing Wealth of Nations: Measuring Sustainable Development in the New Millennium" (2011).
Categories, topics:
Economy & Growth
Last updated:
apr 23, 2017
Indicators value changes by year
Meaning:
7.743
Minimum:
-1.282
jan 1, 2010
Maximum:
16.047
jan 1, 2012
At the date of observation
Value
Absolute change
Change from the previous value
jan 1, 2006
1.179
+1.179
0.0%
jan 1, 2007
15.699
+14.52
1.23K%
jan 1, 2008
11.724
-3.975
-25.32%
jan 1, 2009
4.258
-7.466
-63.68%
jan 1, 2010
-1.282
-5.54
-130.11%
jan 1, 2011
10.318
+11.6
-904.68%
jan 1, 2012
16.047
+5.729
55.53%
jan 1, 2013
7.833
-8.214
-51.19%
jan 1, 2014
4.469
-3.364
-42.94%
jan 1, 2015
7.189
+2.72
60.86%
Ranking of countries by current statistics by years
