29
/
en
AIzaSyAYiBZKx7MnpbEhh9jyipgxe19OcubqV5w
April 1, 2024
248257
Sri Lanka
LKA
true
2
1
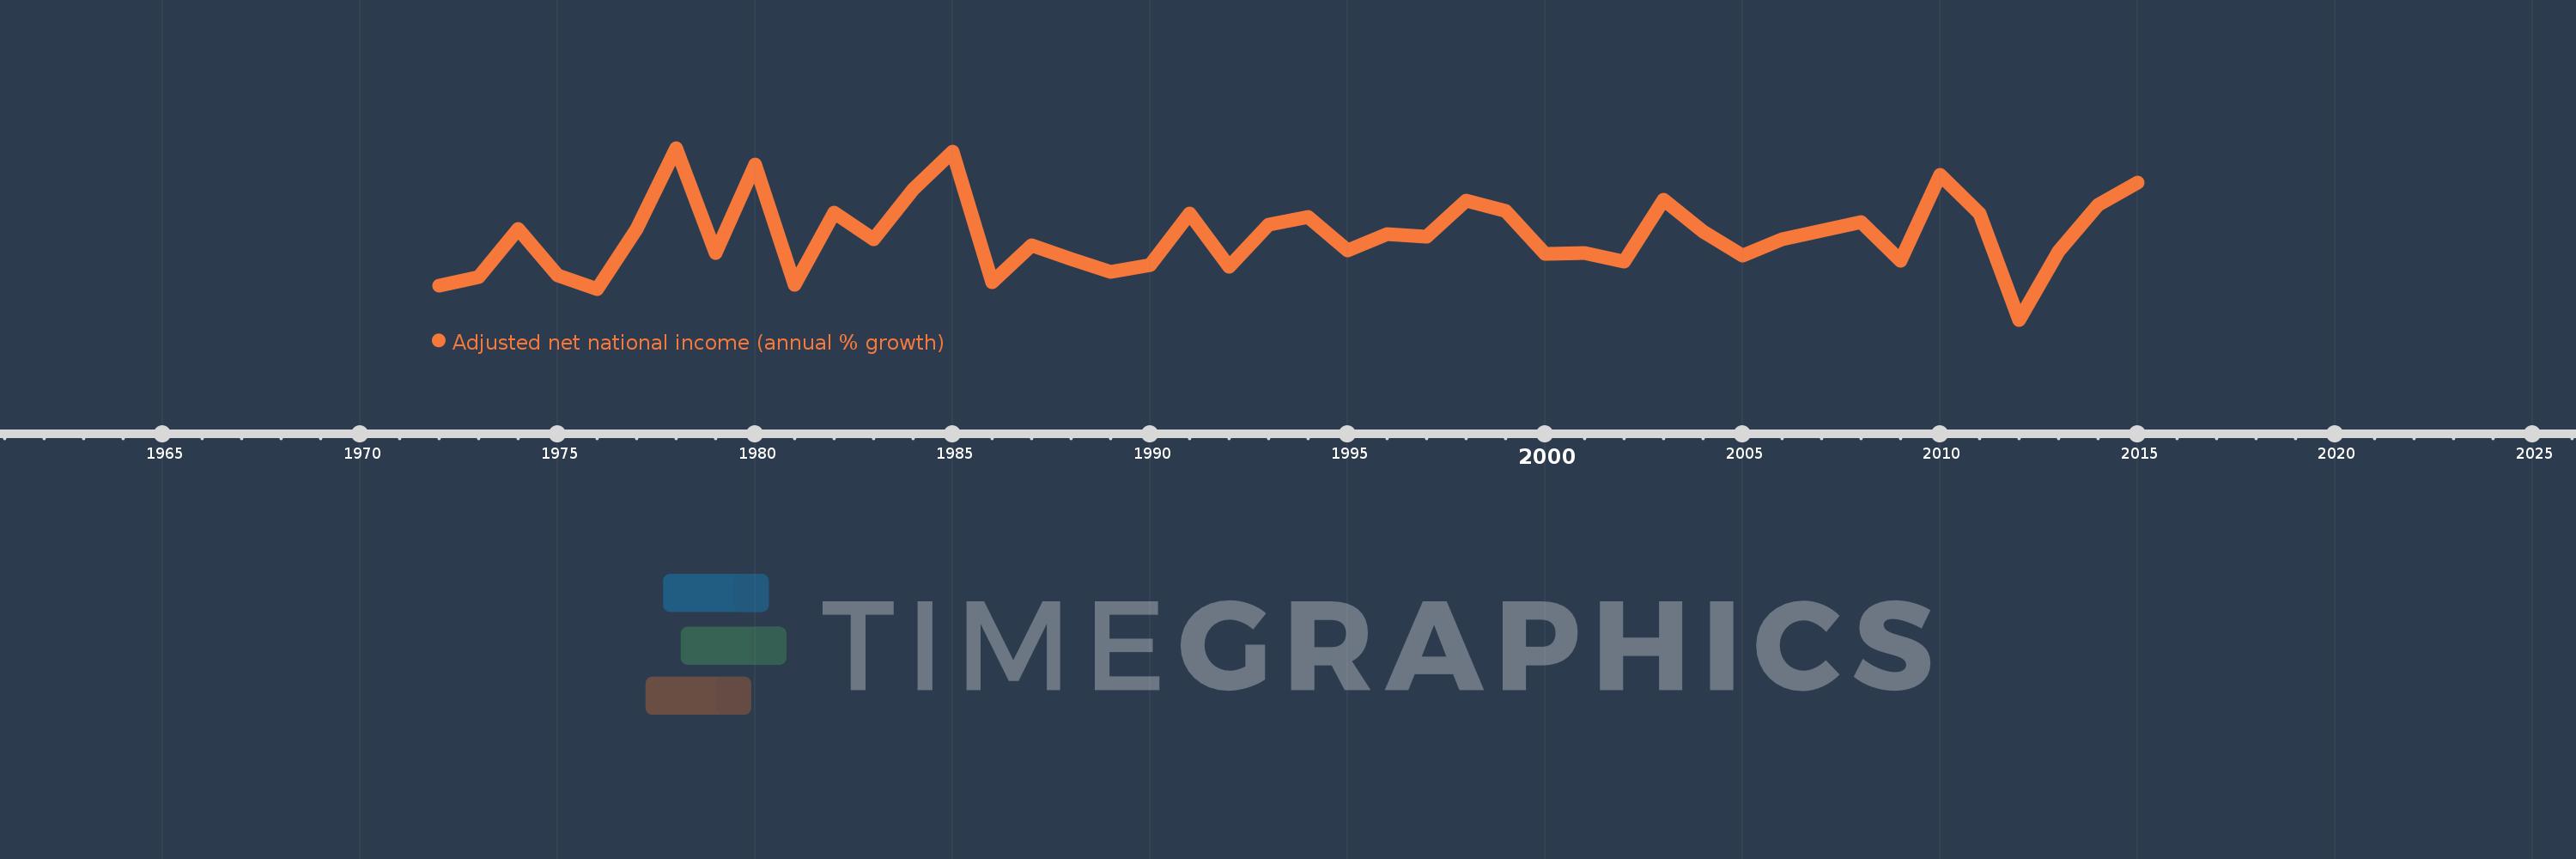
Adjusted net national income (annual % growth)
2015,2014,2013,2012,2011,2010,2009,2008,2007,2006,2005,2004,2003,2002,2001,2000,1999,1998,1997,1996,1995,1994,1993,1992,1991,1990,1989,1988,1987,1986,1985,1984,1983,1982,1981,1980,1979,1978,1977,1976,1975,1974,1973,1972
This statistics in other country:
Timeline:
This timeline shows a graph from 1972 to 2015 of Sri Lanka. No data until 1971. Number of actual observations by date: 44.
Source name:
World Development Indicators
Source organization:
World Bank staff estimates based on sources and methods in World Bank's "The Changing Wealth of Nations: Measuring Sustainable Development in the New Millennium" (2011).
Categories, topics:
Economy & Growth
Last updated:
apr 23, 2017
Indicators value changes by year
Minimum:
-4.729
jan 1, 2012
Maximum:
15.302
jan 1, 1978
At the date of observation
Value
Absolute change
Change from previous value
jan 1, 1972
-0.737
-0.737
0.0%
jan 1, 1973
0.216
+0.953
-129.31%
jan 1, 1974
5.818
+5.602
2.59K%
jan 1, 1975
0.428
-5.391
-92.65%
jan 1, 1976
-1.129
-1.556
-363.98%
jan 1, 1977
5.816
+6.945
-615.38%
jan 1, 1978
15.302
+9.486
163.09%
jan 1, 1979
3.1
-12.202
-79.74%
jan 1, 1980
13.336
+10.237
330.22%
jan 1, 1981
-0.637
-13.974
-104.78%
jan 1, 1982
7.715
+8.353
-1.31K%
jan 1, 1983
4.693
-3.022
-39.17%
jan 1, 1984
10.418
+5.725
121.99%
jan 1, 1985
14.877
+4.459
42.8%
jan 1, 1986
-0.373
-15.25
-102.51%
jan 1, 1987
3.919
+4.292
-1.15K%
jan 1, 1988
2.397
-1.522
-38.84%
jan 1, 1989
0.891
-1.506
-62.82%
jan 1, 1990
1.664
+0.773
86.75%
jan 1, 1991
7.691
+6.027
362.14%
jan 1, 1992
1.496
-6.196
-80.56%
jan 1, 1993
6.364
+4.869
325.56%
jan 1, 1994
7.275
+0.91
14.3%
jan 1, 1995
3.343
-3.932
-54.05%
jan 1, 1996
5.215
+1.872
56.0%
jan 1, 1997
4.945
-0.27
-5.18%
jan 1, 1998
9.154
+4.209
85.12%
jan 1, 1999
7.914
-1.239
-13.54%
jan 1, 2000
2.981
-4.934
-62.34%
jan 1, 2001
3.082
+0.101
3.4%
jan 1, 2002
2.051
-1.031
-33.45%
jan 1, 2003
9.221
+7.17
349.52%
jan 1, 2004
5.595
-3.626
-39.32%
jan 1, 2005
2.748
-2.848
-50.89%
jan 1, 2006
4.642
+1.894
68.94%
jan 1, 2007
5.672
+1.031
22.2%
jan 1, 2008
6.643
+0.97
17.11%
jan 1, 2009
2.181
-4.462
-67.17%
jan 1, 2010
12.201
+10.02
459.45%
jan 1, 2011
7.64
-4.561
-37.38%
jan 1, 2012
-4.729
-12.368
-161.89%
jan 1, 2013
3.292
+8.02
-169.62%
jan 1, 2014
8.7
+5.408
164.28%
jan 1, 2015
11.26
+2.56
29.43%
Ranking of countries by current statistics by years


Comments: