29
/
en
AIzaSyAYiBZKx7MnpbEhh9jyipgxe19OcubqV5w
April 1, 2024
189807
Mali
MLI
true
2
1
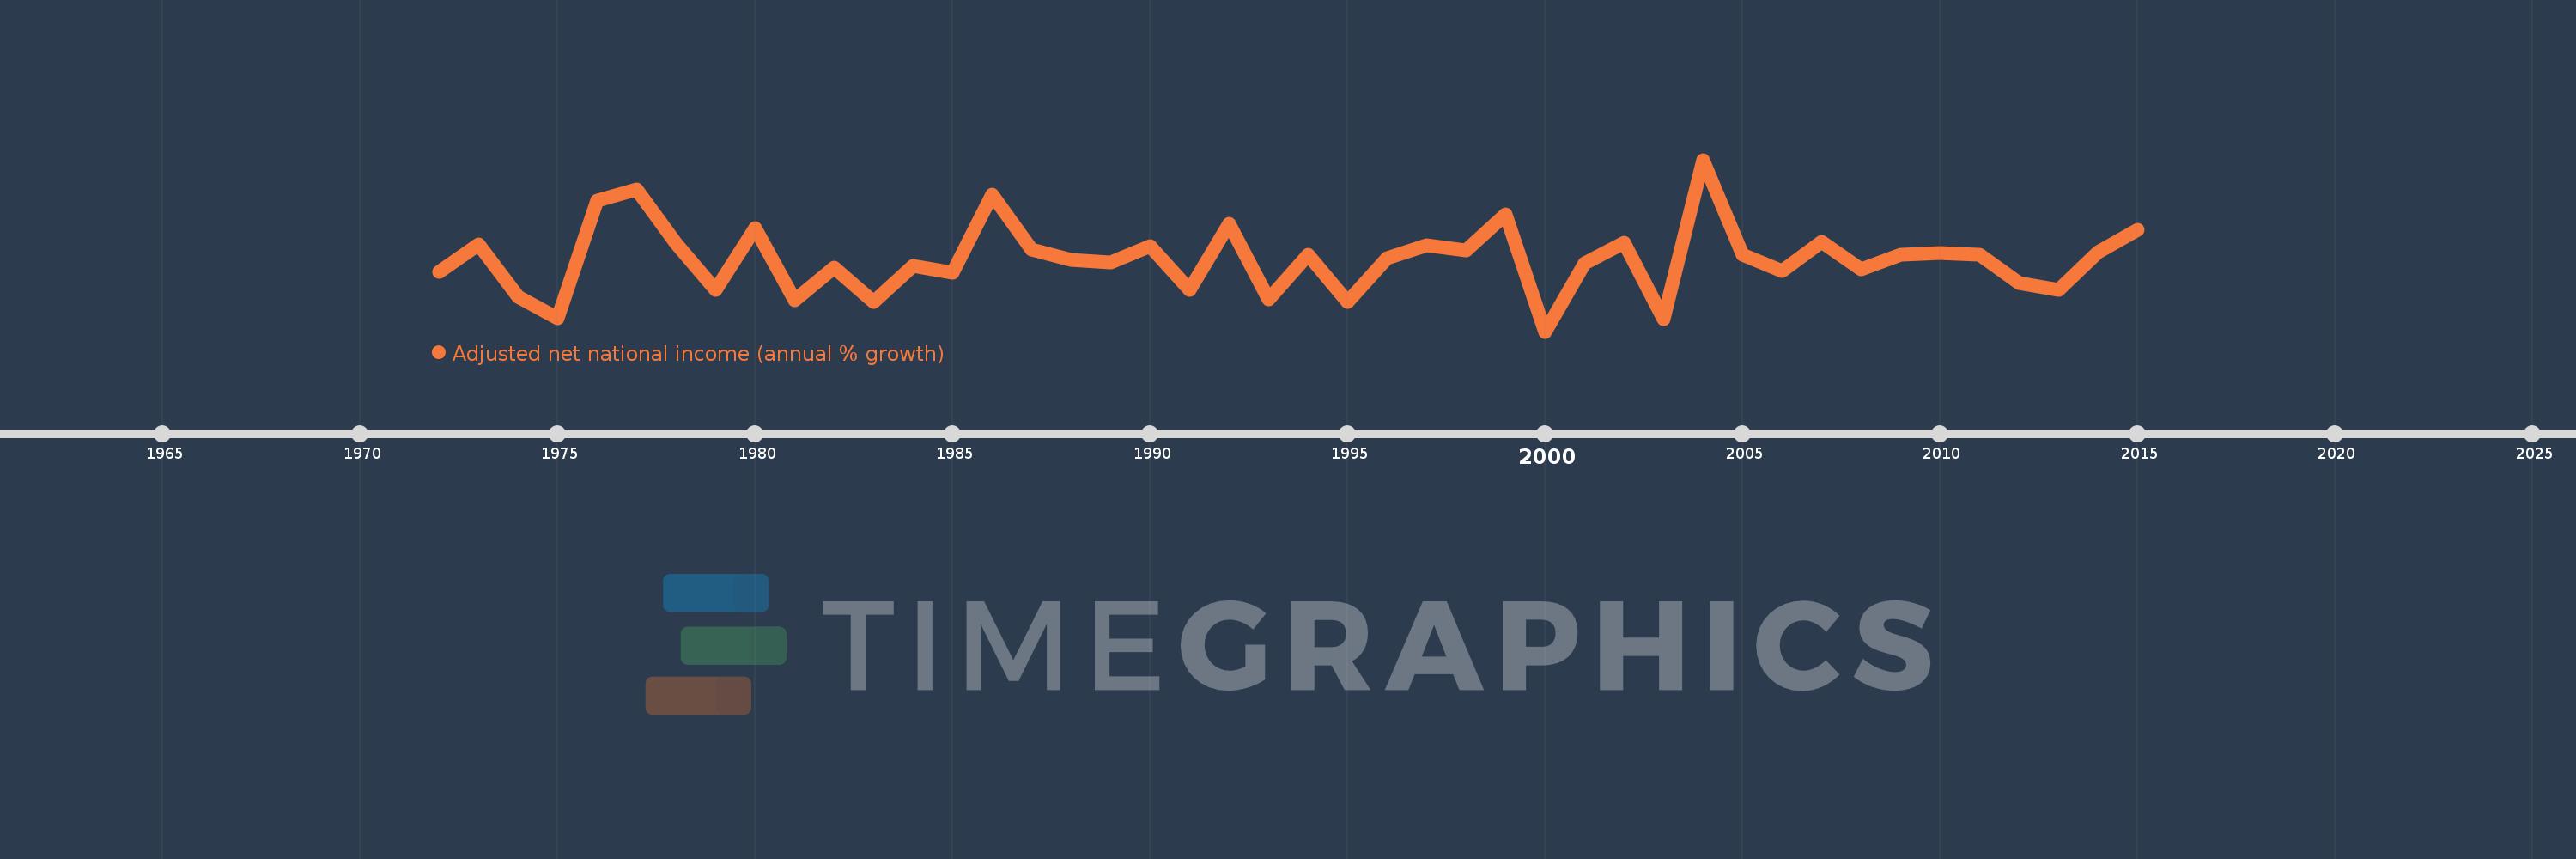
Adjusted net national income (annual % growth)
2015,2014,2013,2012,2011,2010,2009,2008,2007,2006,2005,2004,2003,2002,2001,2000,1999,1998,1997,1996,1995,1994,1993,1992,1991,1990,1989,1988,1987,1986,1985,1984,1983,1982,1981,1980,1979,1978,1977,1976,1975,1974,1973,1972
This statistics in other country:
Timeline:
This timeline shows a graph from 1972 to 2015 of Mali. No data until 1971. Number of actual observations by date: 44.
Source name:
World Development Indicators
Source organization:
World Bank staff estimates based on sources and methods in World Bank's "The Changing Wealth of Nations: Measuring Sustainable Development in the New Millennium" (2011).
Categories, topics:
Economy & Growth
Last updated:
apr 23, 2017
Indicators value changes by year
Minimum:
-12.124
jan 1, 2000
Maximum:
25.355
jan 1, 2004
At the date of observation
Value
Absolute change
Change from previous value
jan 1, 1972
0.815
+0.815
0.0%
jan 1, 1973
6.986
+6.171
757.09%
jan 1, 1974
-4.502
-11.488
-164.44%
jan 1, 1975
-9.21
-4.708
104.57%
jan 1, 1976
16.48
+25.69
-278.93%
jan 1, 1977
18.883
+2.403
14.58%
jan 1, 1978
7.067
-11.816
-62.57%
jan 1, 1979
-3.091
-10.158
-143.74%
jan 1, 1980
10.37
+13.461
-435.49%
jan 1, 1981
-5.234
-15.604
-150.48%
jan 1, 1982
1.836
+7.07
-135.07%
jan 1, 1983
-5.73
-7.565
-412.13%
jan 1, 1984
2.122
+7.852
-137.04%
jan 1, 1985
0.715
-1.407
-66.31%
jan 1, 1986
17.848
+17.133
2.4K%
jan 1, 1987
5.852
-11.996
-67.21%
jan 1, 1988
3.535
-2.316
-39.58%
jan 1, 1989
2.935
-0.601
-16.99%
jan 1, 1990
6.512
+3.577
121.9%
jan 1, 1991
-3.069
-9.581
-147.13%
jan 1, 1992
11.485
+14.554
-474.21%
jan 1, 1993
-5.163
-16.648
-144.95%
jan 1, 1994
4.564
+9.726
-188.4%
jan 1, 1995
-5.578
-10.142
-222.22%
jan 1, 1996
3.82
+9.398
-168.49%
jan 1, 1997
6.79
+2.97
77.75%
jan 1, 1998
5.598
-1.192
-17.56%
jan 1, 1999
13.546
+7.948
141.97%
jan 1, 2000
-12.124
-25.67
-189.5%
jan 1, 2001
2.766
+14.889
-122.81%
jan 1, 2002
7.284
+4.518
163.38%
jan 1, 2003
-9.369
-16.653
-228.62%
jan 1, 2004
25.355
+34.724
-370.63%
jan 1, 2005
4.556
-20.799
-82.03%
jan 1, 2006
1.014
-3.542
-77.74%
jan 1, 2007
7.479
+6.466
637.7%
jan 1, 2008
1.448
-6.031
-80.63%
jan 1, 2009
4.689
+3.241
223.74%
jan 1, 2010
5.034
+0.345
7.36%
jan 1, 2011
4.603
-0.431
-8.57%
jan 1, 2012
-1.576
-6.179
-134.24%
jan 1, 2013
-2.971
-1.395
88.49%
jan 1, 2014
5.266
+8.237
-277.27%
jan 1, 2015
10.159
+4.892
92.89%
Ranking of countries by current statistics by years


Comments: