29
/
en
AIzaSyAYiBZKx7MnpbEhh9jyipgxe19OcubqV5w
April 1, 2024
37899
IDA blend
IDB
false
2
1
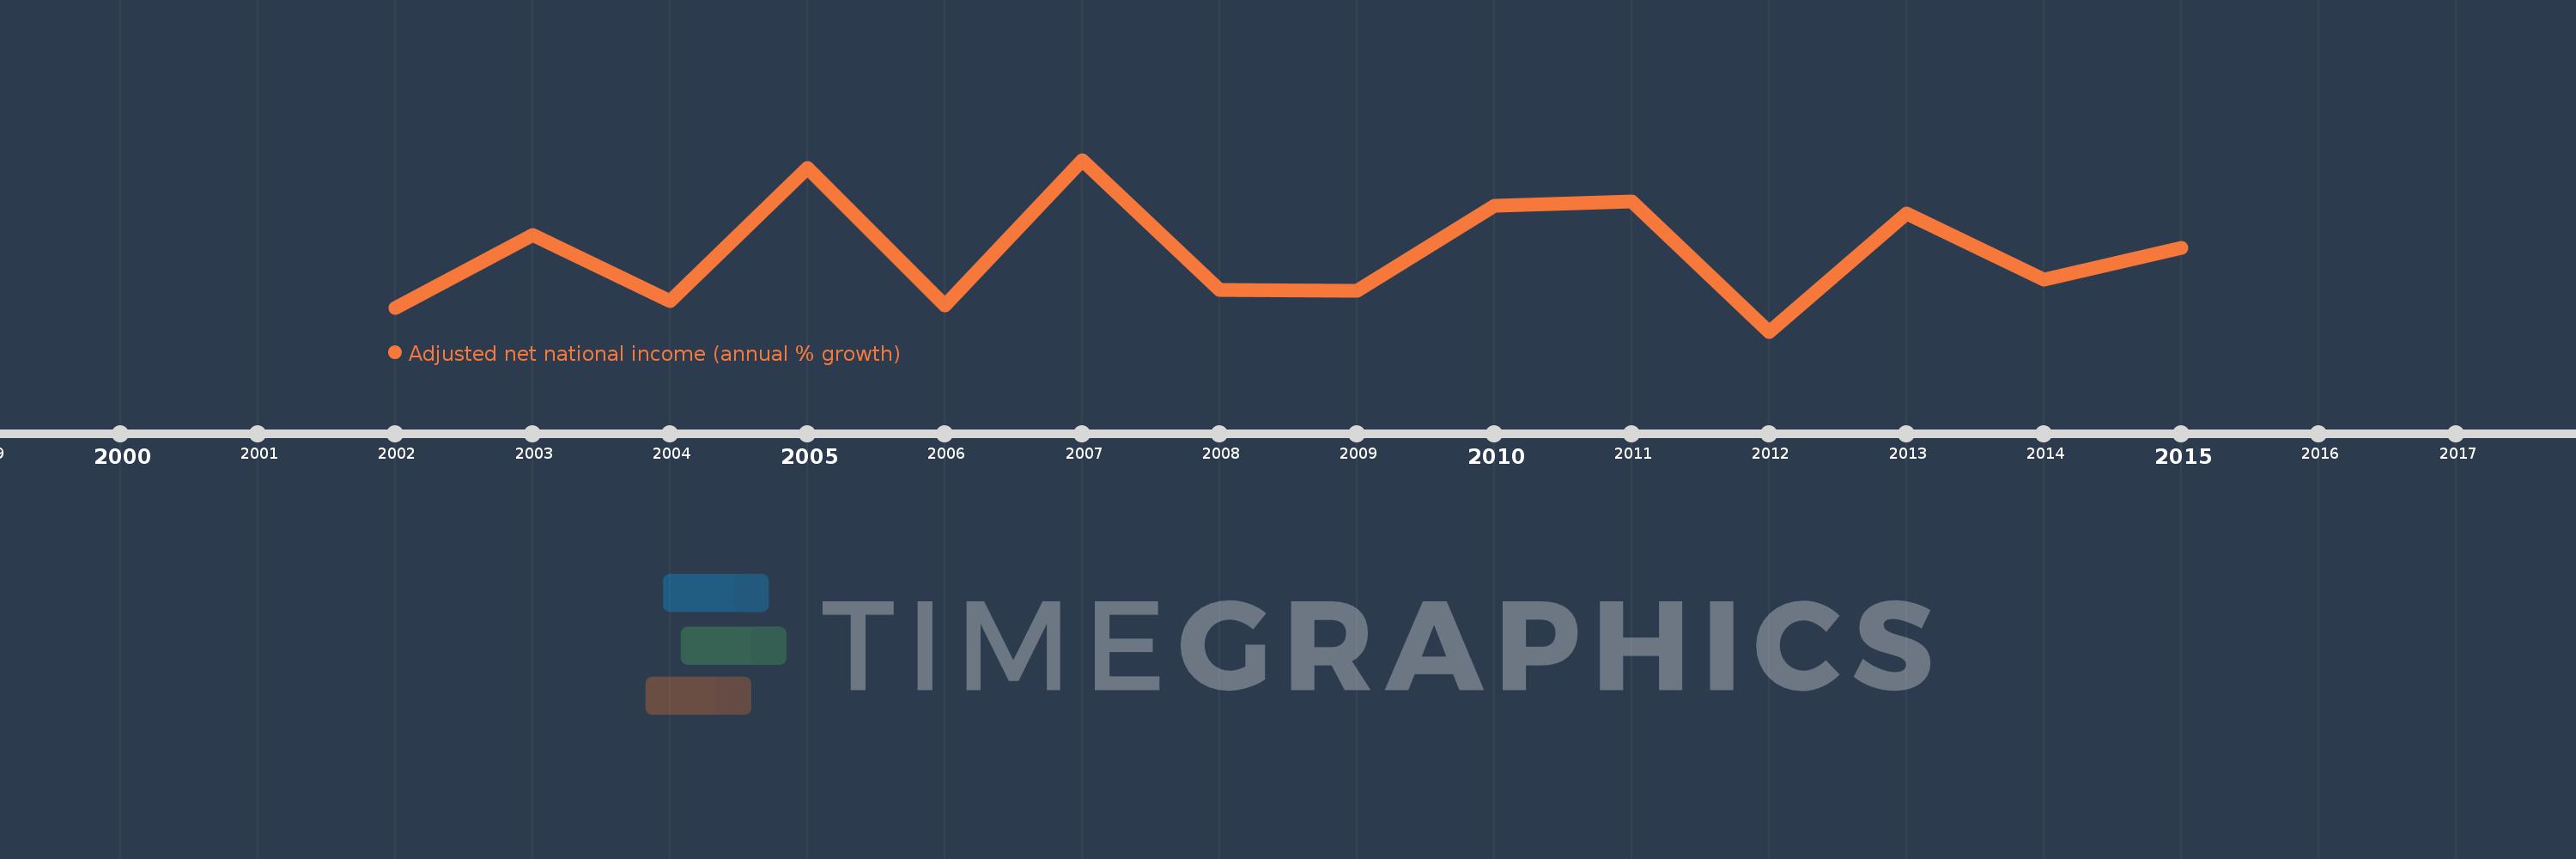
Adjusted net national income (annual % growth)
2015,2014,2013,2012,2011,2010,2009,2008,2007,2006,2005,2004,2003,2002
This statistics in other country:
Timeline:
This timeline shows a graph from 2002 to 2015 of IDA blend. No data until 2001. Number of actual observations by date: 14.
Source name:
World Development Indicators
Source organization:
World Bank staff estimates based on sources and methods in World Bank's "The Changing Wealth of Nations: Measuring Sustainable Development in the New Millennium" (2011).
Categories, topics:
Economy & Growth
Last updated:
apr 23, 2017
Indicators value changes by year
At the date of observation
Value
Absolute change
Change from previous value
jan 1, 2002
2.244
+2.244
0.0%
jan 1, 2003
8.392
+6.148
273.98%
jan 1, 2004
2.795
-5.597
-66.69%
jan 1, 2005
14.068
+11.273
403.32%
jan 1, 2006
2.422
-11.646
-82.78%
jan 1, 2007
14.79
+12.368
510.56%
jan 1, 2008
3.739
-11.051
-74.72%
jan 1, 2009
3.706
-0.034
-0.9%
jan 1, 2010
10.89
+7.185
193.89%
jan 1, 2011
11.255
+0.365
3.35%
jan 1, 2012
0.223
-11.033
-98.02%
jan 1, 2013
10.246
+10.024
4.5K%
jan 1, 2014
4.651
-5.595
-54.61%
jan 1, 2015
7.333
+2.681
57.65%
Ranking of countries by current statistics by years


Comments: