29
/
en
AIzaSyAYiBZKx7MnpbEhh9jyipgxe19OcubqV5w
April 1, 2024
179703
Libya
LBY
true
2
1
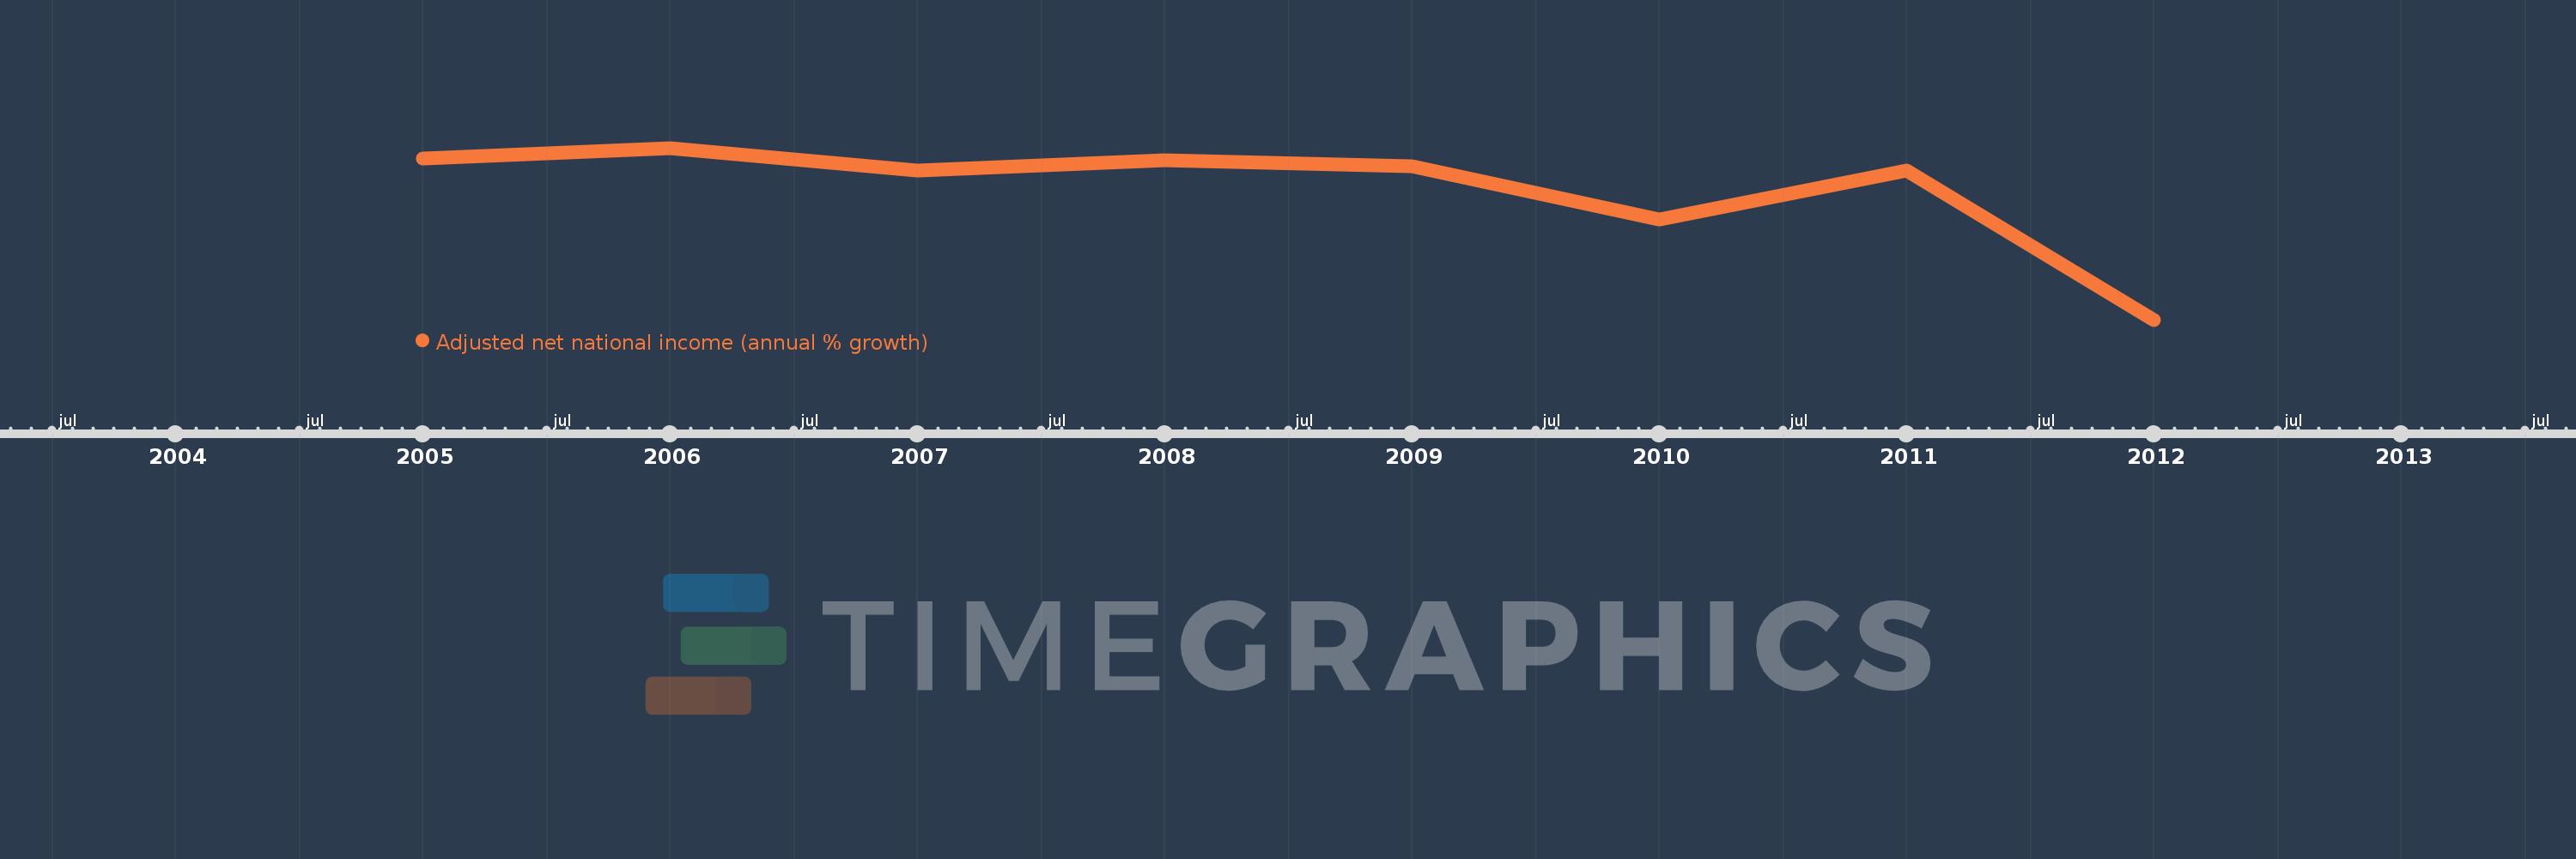
Adjusted net national income (annual % growth)
2012,2011,2010,2009,2008,2007,2006,2005
This statistics in other country:
Timeline:
This timeline shows a graph from 2005 to 2012 of Libya. No data until 2004. Number of actual observations by date: 8.
Source name:
World Development Indicators
Source organization:
World Bank staff estimates based on sources and methods in World Bank's "The Changing Wealth of Nations: Measuring Sustainable Development in the New Millennium" (2011).
Categories, topics:
Economy & Growth
Last updated:
apr 23, 2017
Indicators value changes by year
Minimum:
-59.602
jan 1, 2012
At the date of observation
Value
Absolute change
Change from previous value
jan 1, 2005
14.224
+14.224
0.0%
jan 1, 2006
19.2
+4.975
34.98%
jan 1, 2007
8.869
-10.331
-53.81%
jan 1, 2008
13.4
+4.531
51.09%
jan 1, 2009
10.94
-2.46
-18.36%
jan 1, 2010
-13.634
-24.574
-224.63%
jan 1, 2011
8.949
+22.583
-165.64%
jan 1, 2012
-59.602
-68.552
-765.99%
Ranking of countries by current statistics by years


Comments: