29
/
en
AIzaSyAYiBZKx7MnpbEhh9jyipgxe19OcubqV5w
April 1, 2024
221750
Peru
PER
true
2
1
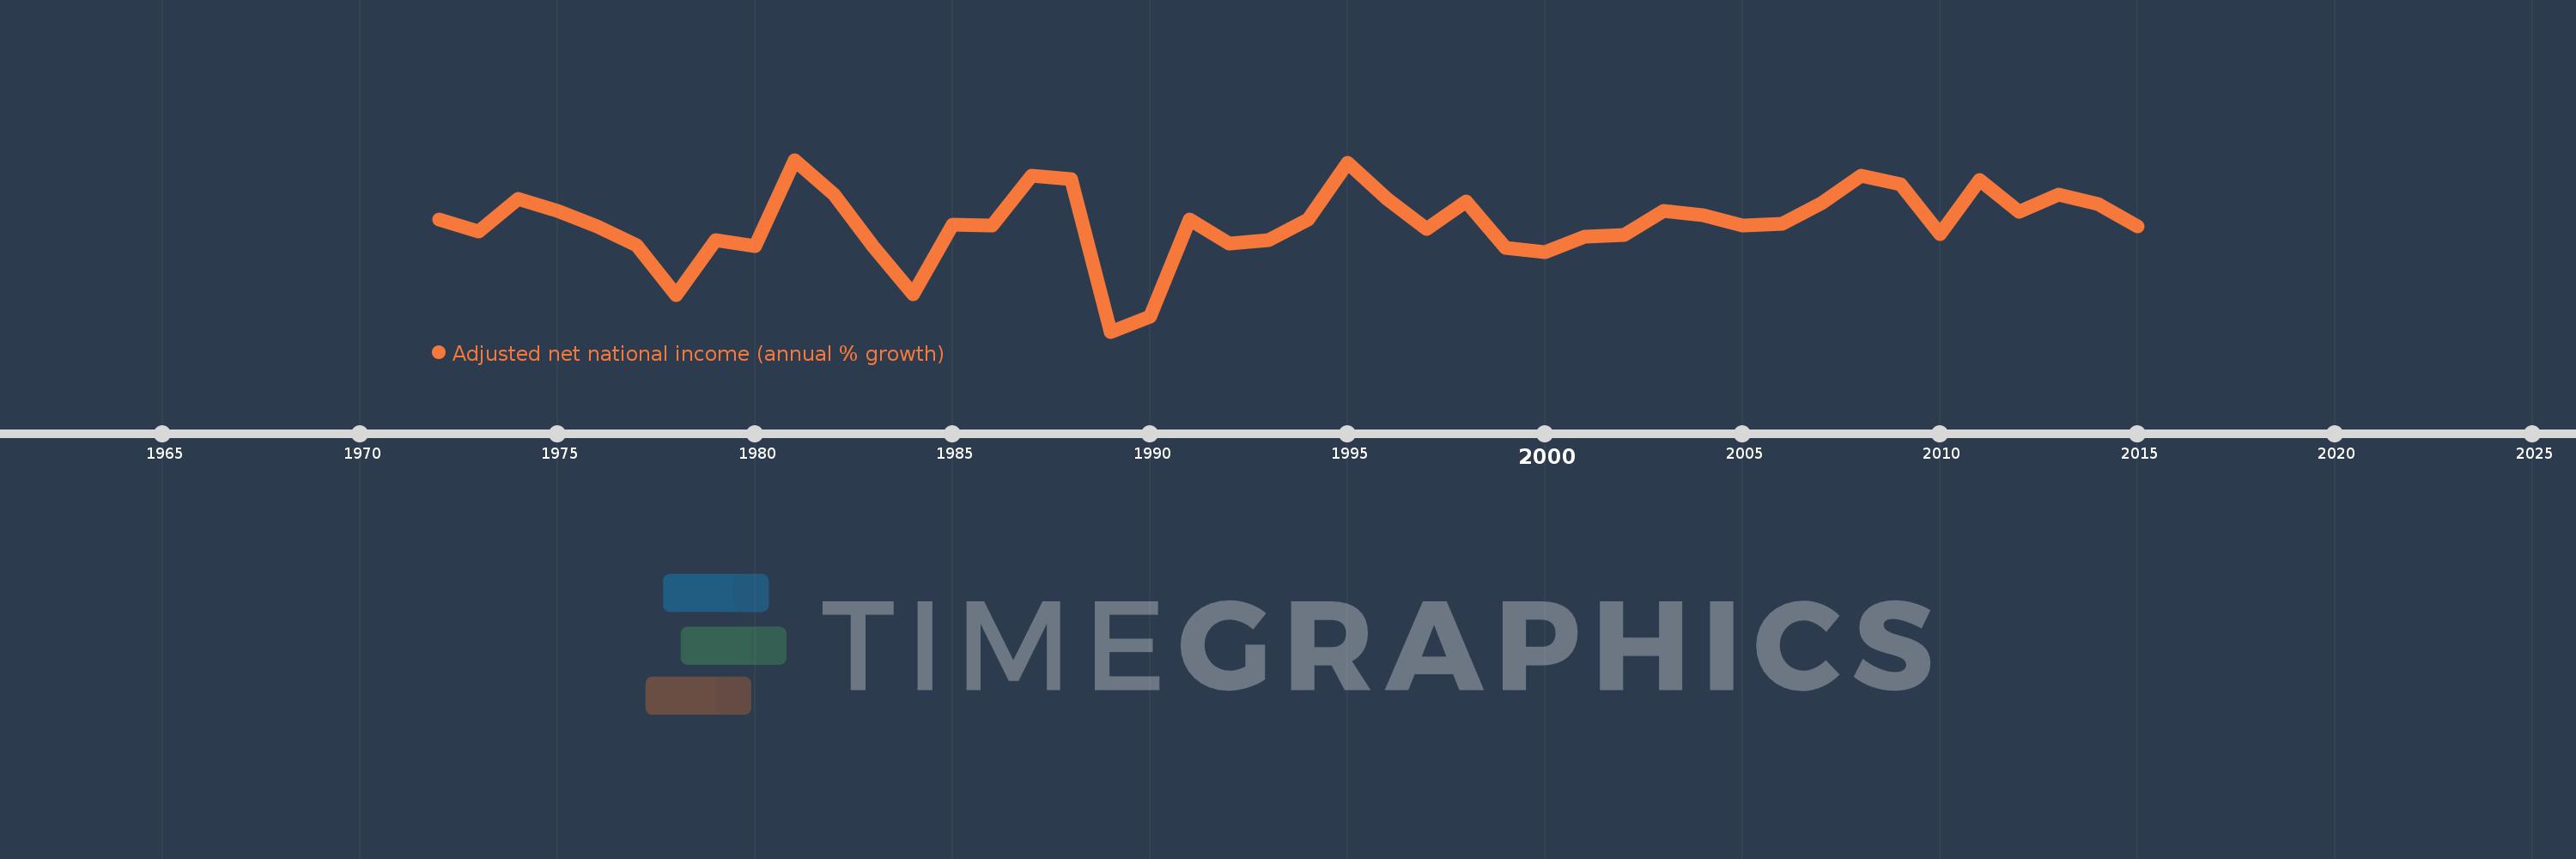
Adjusted net national income (annual % growth)
2015,2014,2013,2012,2011,2010,2009,2008,2007,2006,2005,2004,2003,2002,2001,2000,1999,1998,1997,1996,1995,1994,1993,1992,1991,1990,1989,1988,1987,1986,1985,1984,1983,1982,1981,1980,1979,1978,1977,1976,1975,1974,1973,1972
This statistics in other country:
Timeline:
This timeline shows a graph from 1972 to 2015 of Peru. No data until 1971. Number of actual observations by date: 44.
Source name:
World Development Indicators
Source organization:
World Bank staff estimates based on sources and methods in World Bank's "The Changing Wealth of Nations: Measuring Sustainable Development in the New Millennium" (2011).
Categories, topics:
Economy & Growth
Last updated:
apr 23, 2017
Indicators value changes by year
Minimum:
-16.89
jan 1, 1989
Maximum:
15.494
jan 1, 1981
At the date of observation
Value
Absolute change
Change from previous value
jan 1, 1972
4.167
+4.167
0.0%
jan 1, 1973
1.998
-2.169
-52.04%
jan 1, 1974
8.126
+6.128
306.67%
jan 1, 1975
5.9
-2.227
-27.4%
jan 1, 1976
3.0
-2.899
-49.15%
jan 1, 1977
-0.562
-3.562
-118.73%
jan 1, 1978
-9.997
-9.435
1.68K%
jan 1, 1979
0.336
+10.332
-103.36%
jan 1, 1980
-0.818
-1.153
-343.67%
jan 1, 1981
15.494
+16.312
-1.99K%
jan 1, 1982
8.935
-6.559
-42.33%
jan 1, 1983
-0.907
-9.842
-110.15%
jan 1, 1984
-9.85
-8.943
985.71%
jan 1, 1985
3.295
+13.145
-133.45%
jan 1, 1986
3.126
-0.169
-5.12%
jan 1, 1987
12.466
+9.34
298.74%
jan 1, 1988
11.91
-0.556
-4.46%
jan 1, 1989
-16.89
-28.8
-241.81%
jan 1, 1990
-14.119
+2.771
-16.41%
jan 1, 1991
4.216
+18.336
-129.86%
jan 1, 1992
-0.359
-4.575
-108.5%
jan 1, 1993
0.339
+0.698
-194.57%
jan 1, 1994
4.257
+3.918
1.16K%
jan 1, 1995
14.885
+10.628
249.63%
jan 1, 1996
8.085
-6.8
-45.68%
jan 1, 1997
2.499
-5.587
-69.1%
jan 1, 1998
7.6
+5.101
204.13%
jan 1, 1999
-1.049
-8.649
-113.81%
jan 1, 2000
-1.946
-0.897
85.49%
jan 1, 2001
1.03
+2.976
-152.9%
jan 1, 2002
1.347
+0.318
30.86%
jan 1, 2003
5.86
+4.512
334.91%
jan 1, 2004
5.082
-0.778
-13.27%
jan 1, 2005
3.17
-1.912
-37.63%
jan 1, 2006
3.351
+0.181
5.71%
jan 1, 2007
7.247
+3.896
116.28%
jan 1, 2008
12.562
+5.315
73.35%
jan 1, 2009
10.898
-1.664
-13.25%
jan 1, 2010
1.444
-9.454
-86.75%
jan 1, 2011
11.646
+10.202
706.59%
jan 1, 2012
5.692
-5.954
-51.12%
jan 1, 2013
8.862
+3.17
55.69%
jan 1, 2014
7.092
-1.77
-19.97%
jan 1, 2015
2.939
-4.153
-58.56%
Ranking of countries by current statistics by years


Comments: