29
/
en
AIzaSyAYiBZKx7MnpbEhh9jyipgxe19OcubqV5w
April 1, 2024
241264
Slovak Republic
SVK
true
2
1
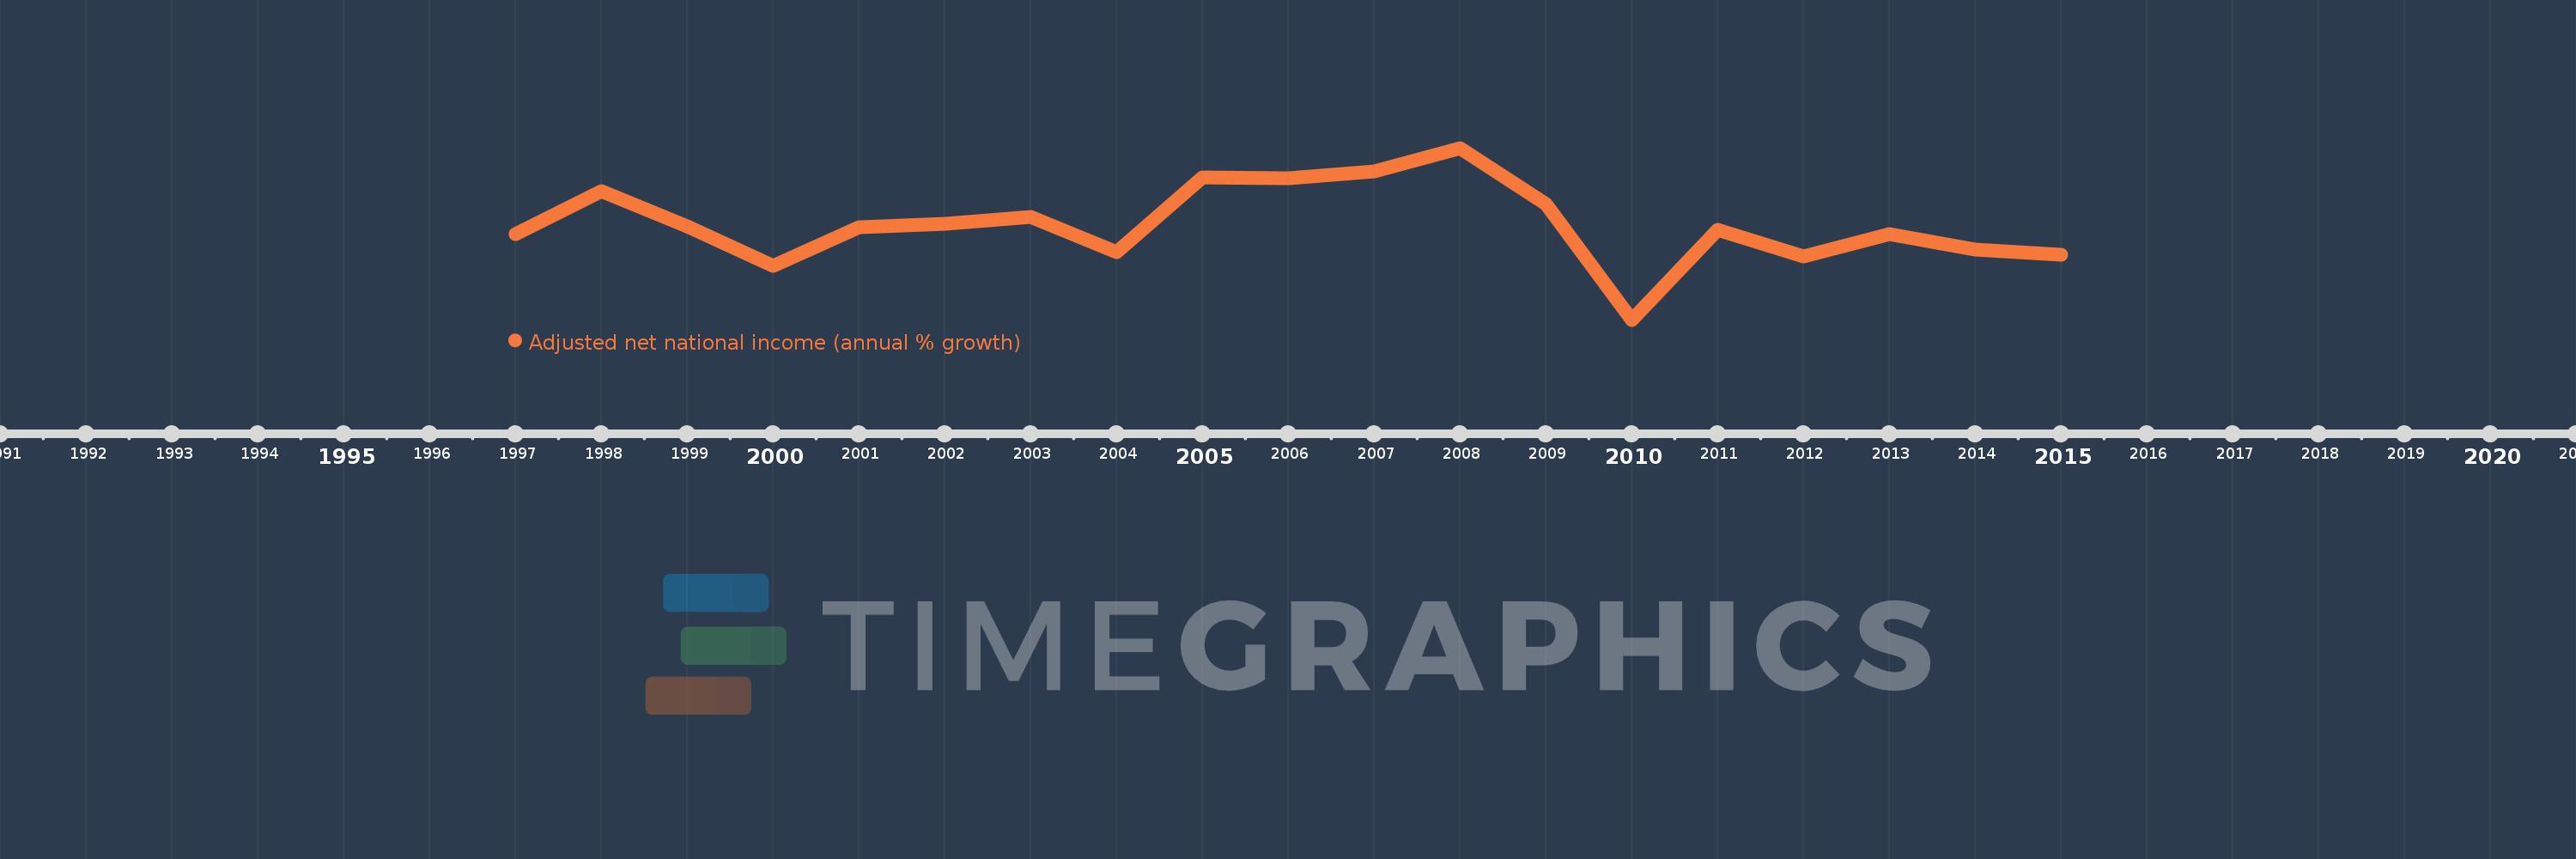
Adjusted net national income (annual % growth)
2015,2014,2013,2012,2011,2010,2009,2008,2007,2006,2005,2004,2003,2002,2001,2000,1999,1998,1997
This statistics in other country:
Timeline:
This timeline shows a graph from 1997 to 2015 of Slovak Republic. No data until 1996. Number of actual observations by date: 19.
Source name:
World Development Indicators
Source organization:
World Bank staff estimates based on sources and methods in World Bank's "The Changing Wealth of Nations: Measuring Sustainable Development in the New Millennium" (2011).
Categories, topics:
Economy & Growth
Last updated:
apr 23, 2017
Indicators value changes by year
Minimum:
-7.275
jan 1, 2010
Maximum:
11.952
jan 1, 2008
At the date of observation
Value
Absolute change
Change from previous value
jan 1, 1997
2.317
+2.317
0.0%
jan 1, 1998
7.136
+4.819
207.96%
jan 1, 1999
3.177
-3.959
-55.48%
jan 1, 2000
-1.213
-4.389
-138.18%
jan 1, 2001
3.079
+4.292
-353.88%
jan 1, 2002
3.451
+0.372
12.09%
jan 1, 2003
4.233
+0.782
22.65%
jan 1, 2004
0.295
-3.938
-93.03%
jan 1, 2005
8.679
+8.384
2.84K%
jan 1, 2006
8.587
-0.092
-1.06%
jan 1, 2007
9.317
+0.731
8.51%
jan 1, 2008
11.952
+2.634
28.27%
jan 1, 2009
5.709
-6.242
-52.23%
jan 1, 2010
-7.275
-12.985
-227.43%
jan 1, 2011
2.763
+10.038
-137.97%
jan 1, 2012
-0.222
-2.985
-108.04%
jan 1, 2013
2.28
+2.502
-1.13K%
jan 1, 2014
0.626
-1.655
-72.57%
jan 1, 2015
-0.014
-0.64
-102.29%
Ranking of countries by current statistics by years


Comments: