This statistics in other country:
Timeline:
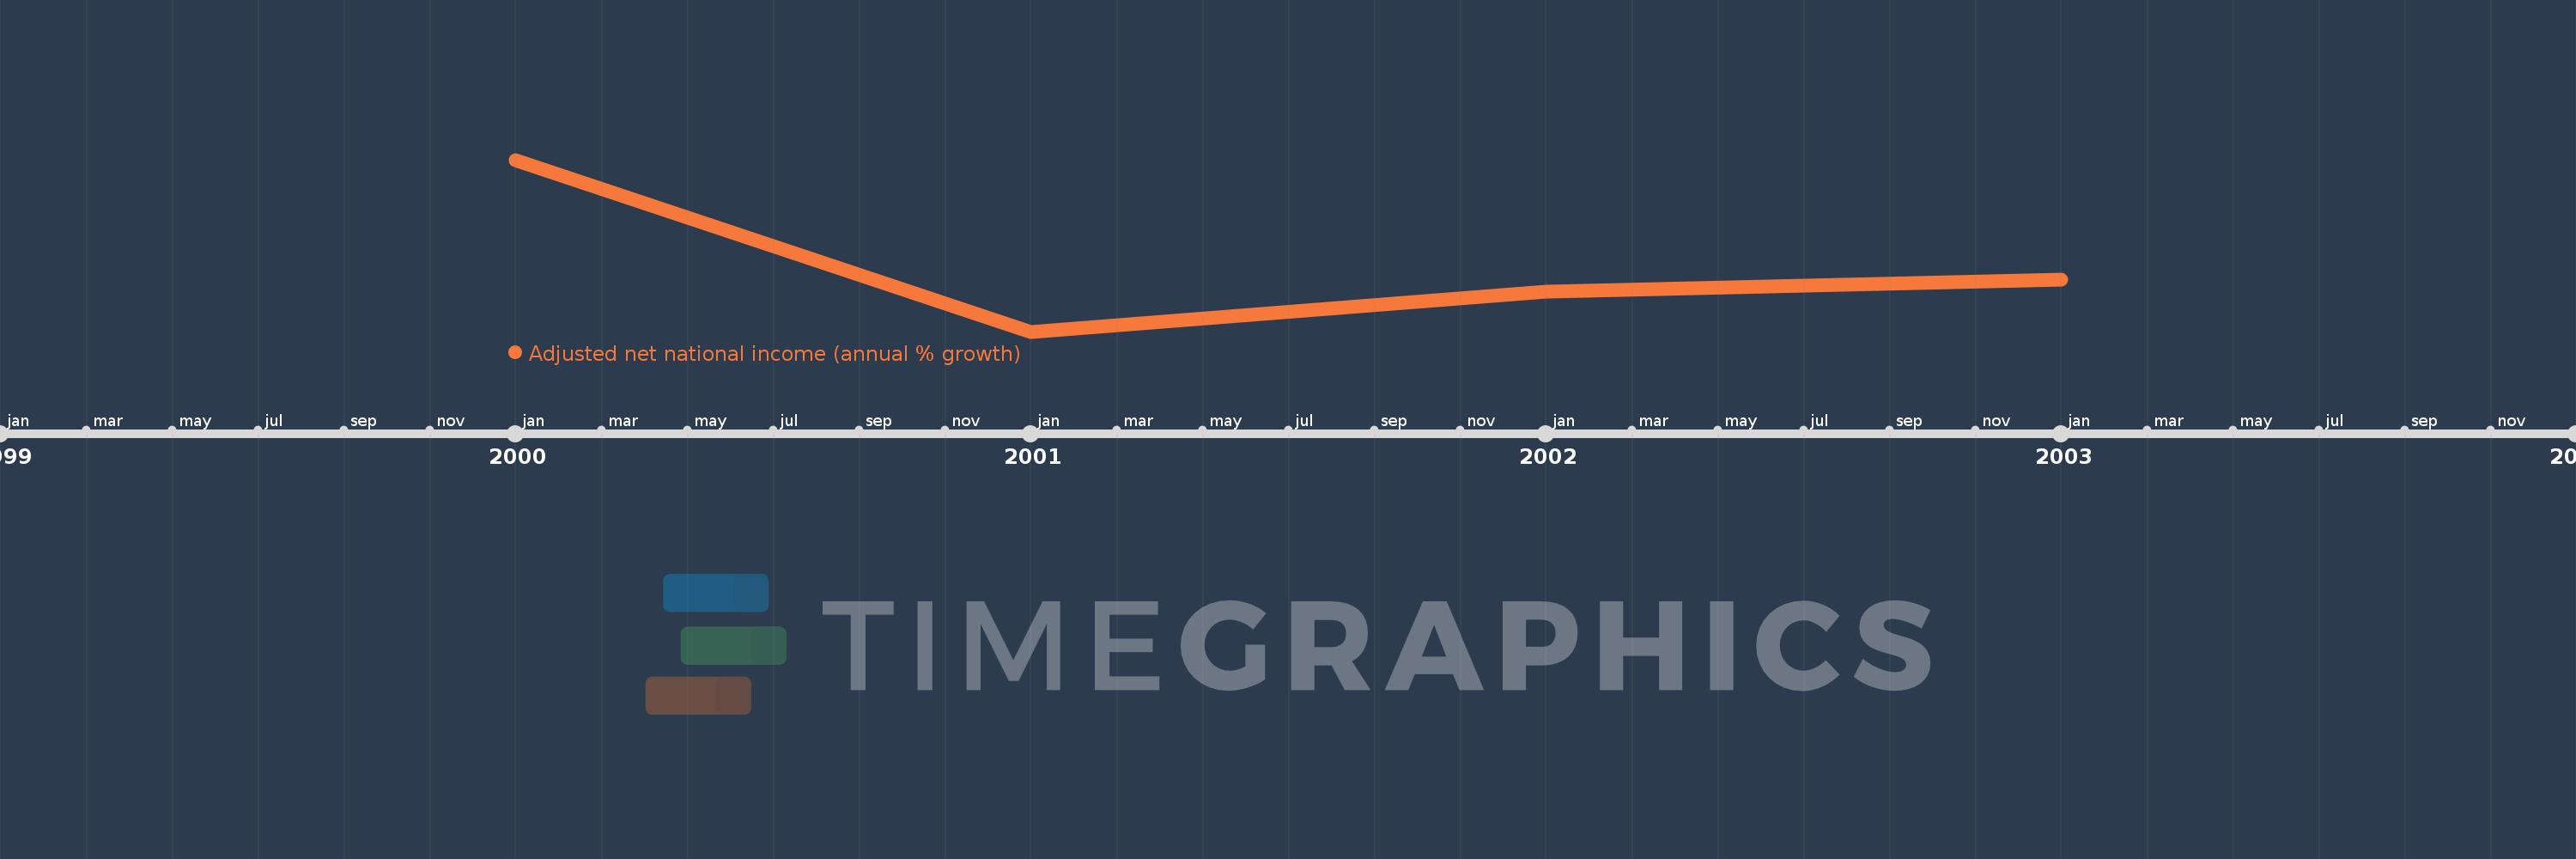
This timeline shows a graph from 2000 to 2003 of Lao PDR. No data until 1999. Number of actual observations by date: 4.
Source name:
World Development Indicators
Source organization:
World Bank staff estimates based on sources and methods in World Bank's "The Changing Wealth of Nations: Measuring Sustainable Development in the New Millennium" (2011).
Categories, topics:
Economy & Growth
Last updated:
apr 23, 2017
Indicators value changes by year
Maximum:
12.026
jan 1, 2000
At the date of observation
Value
Absolute change
Change from previous value
jan 1, 2000
12.026
+12.026
0.0%
jan 1, 2001
4.936
-7.089
-58.95%
jan 1, 2002
6.601
+1.665
33.73%
jan 1, 2003
7.091
+0.49
7.42%
Ranking of countries by current statistics by years


Comments: