29
/
en
AIzaSyAYiBZKx7MnpbEhh9jyipgxe19OcubqV5w
April 1, 2024
204890
Namibia
NAM
true
2
1
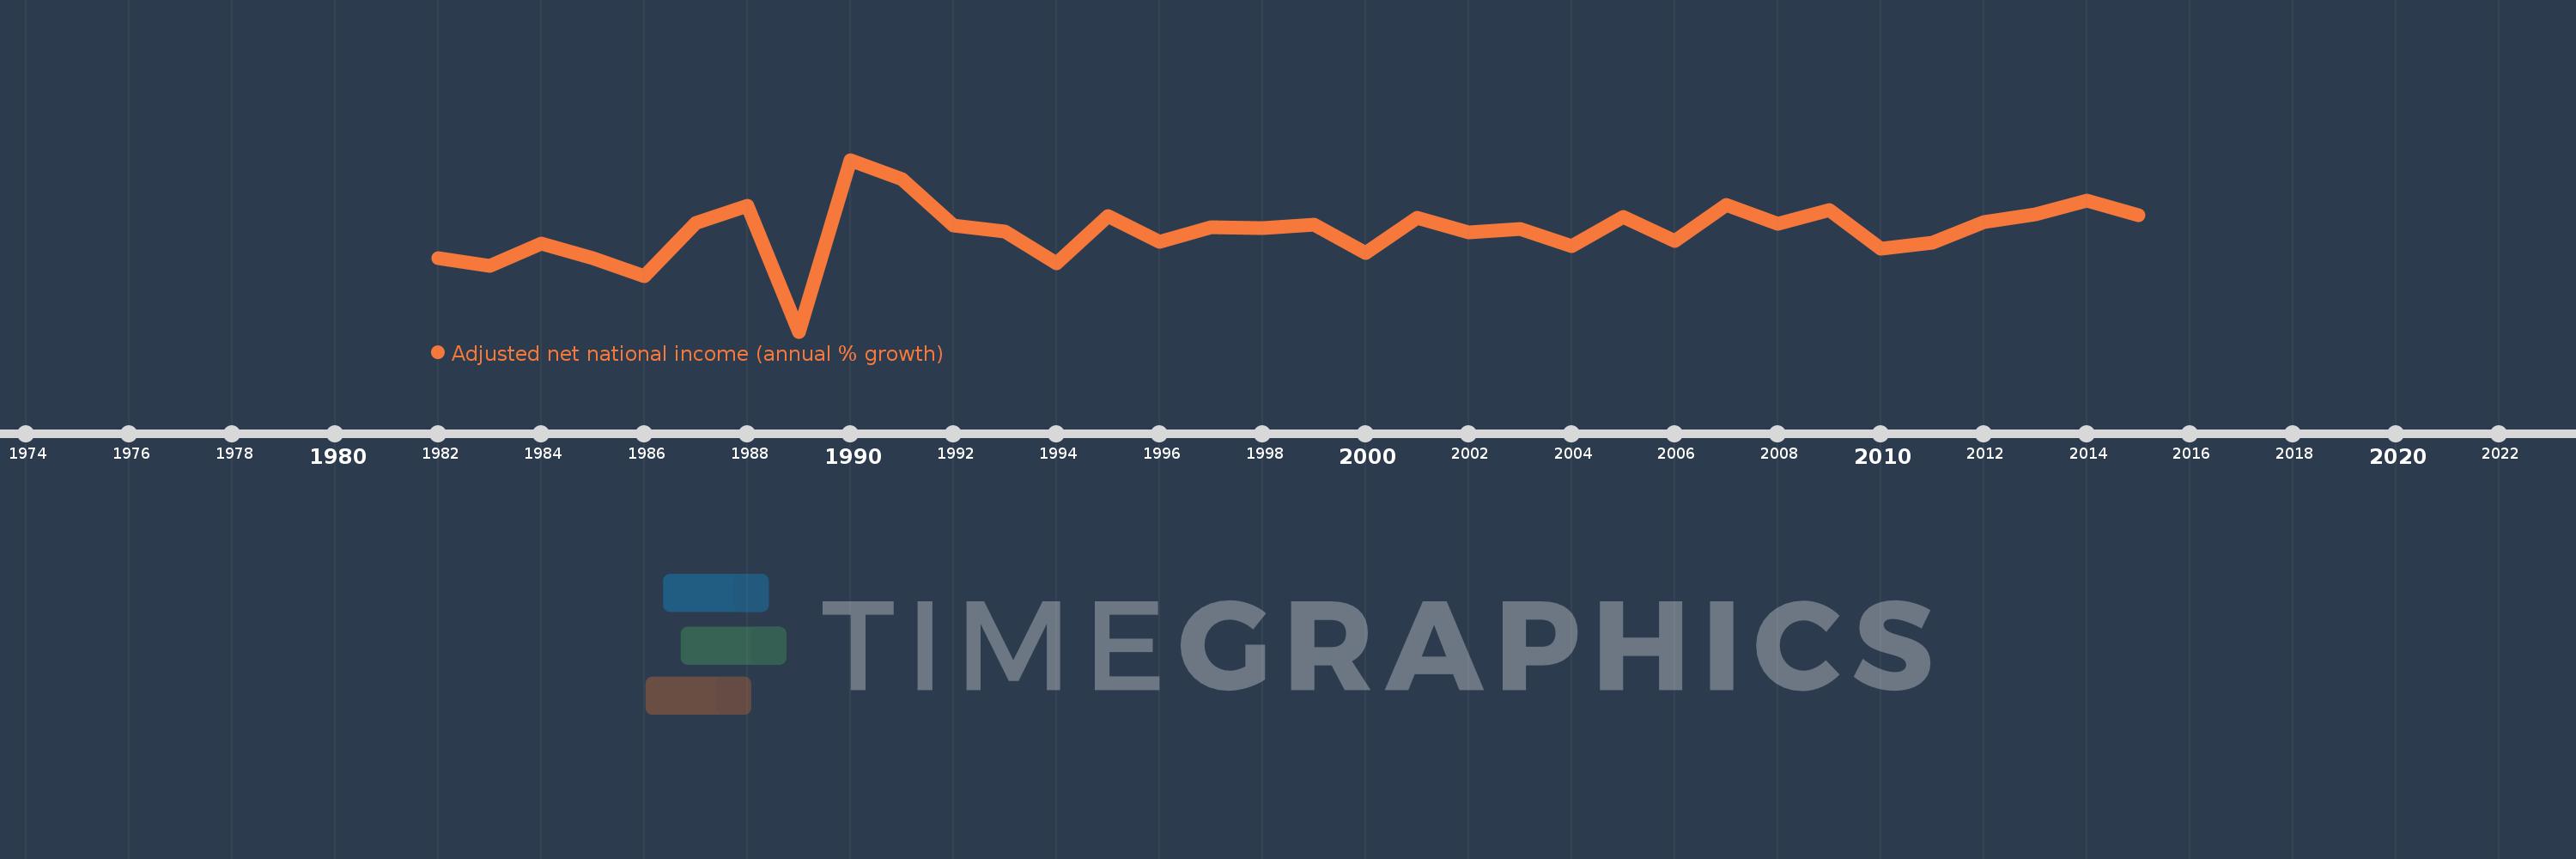
Adjusted net national income (annual % growth)
2015,2014,2013,2012,2011,2010,2009,2008,2007,2006,2005,2004,2003,2002,2001,2000,1999,1998,1997,1996,1995,1994,1993,1992,1991,1990,1989,1988,1987,1986,1985,1984,1983,1982
This statistics in other country:
Timeline:
This timeline shows a graph from 1982 to 2015 of Namibia. No data until 1981. Number of actual observations by date: 34.
Source name:
World Development Indicators
Source organization:
World Bank staff estimates based on sources and methods in World Bank's "The Changing Wealth of Nations: Measuring Sustainable Development in the New Millennium" (2011).
Categories, topics:
Economy & Growth
Last updated:
apr 23, 2017
Indicators value changes by year
Minimum:
-20.258
jan 1, 1989
At the date of observation
Value
Absolute change
Change from previous value
jan 1, 1982
-1.993
-1.993
0.0%
jan 1, 1983
-3.77
-1.777
89.16%
jan 1, 1984
1.83
+5.6
-148.55%
jan 1, 1985
-1.97
-3.8
-207.6%
jan 1, 1986
-6.515
-4.545
230.79%
jan 1, 1987
6.955
+13.47
-206.75%
jan 1, 1988
11.16
+4.205
60.47%
jan 1, 1989
-20.258
-31.419
-281.53%
jan 1, 1990
22.64
+42.898
-211.75%
jan 1, 1991
17.752
-4.888
-21.59%
jan 1, 1992
6.125
-11.627
-65.5%
jan 1, 1993
4.733
-1.391
-22.71%
jan 1, 1994
-3.171
-7.904
-166.98%
jan 1, 1995
8.523
+11.694
-368.82%
jan 1, 1996
2.084
-6.44
-75.55%
jan 1, 1997
5.774
+3.69
177.1%
jan 1, 1998
5.49
-0.284
-4.92%
jan 1, 1999
6.5
+1.01
18.4%
jan 1, 2000
-0.615
-7.115
-109.46%
jan 1, 2001
8.076
+8.691
-1.41K%
jan 1, 2002
4.464
-3.612
-44.72%
jan 1, 2003
5.458
+0.993
22.25%
jan 1, 2004
0.989
-4.468
-81.87%
jan 1, 2005
8.289
+7.3
737.77%
jan 1, 2006
2.307
-5.982
-72.17%
jan 1, 2007
11.366
+9.059
392.73%
jan 1, 2008
6.574
-4.792
-42.16%
jan 1, 2009
9.994
+3.42
52.02%
jan 1, 2010
0.35
-9.644
-96.5%
jan 1, 2011
2.031
+1.681
479.88%
jan 1, 2012
7.188
+5.157
253.9%
jan 1, 2013
8.913
+1.725
24.0%
jan 1, 2014
12.382
+3.468
38.91%
jan 1, 2015
8.732
-3.65
-29.48%
Ranking of countries by current statistics by years


Comments: