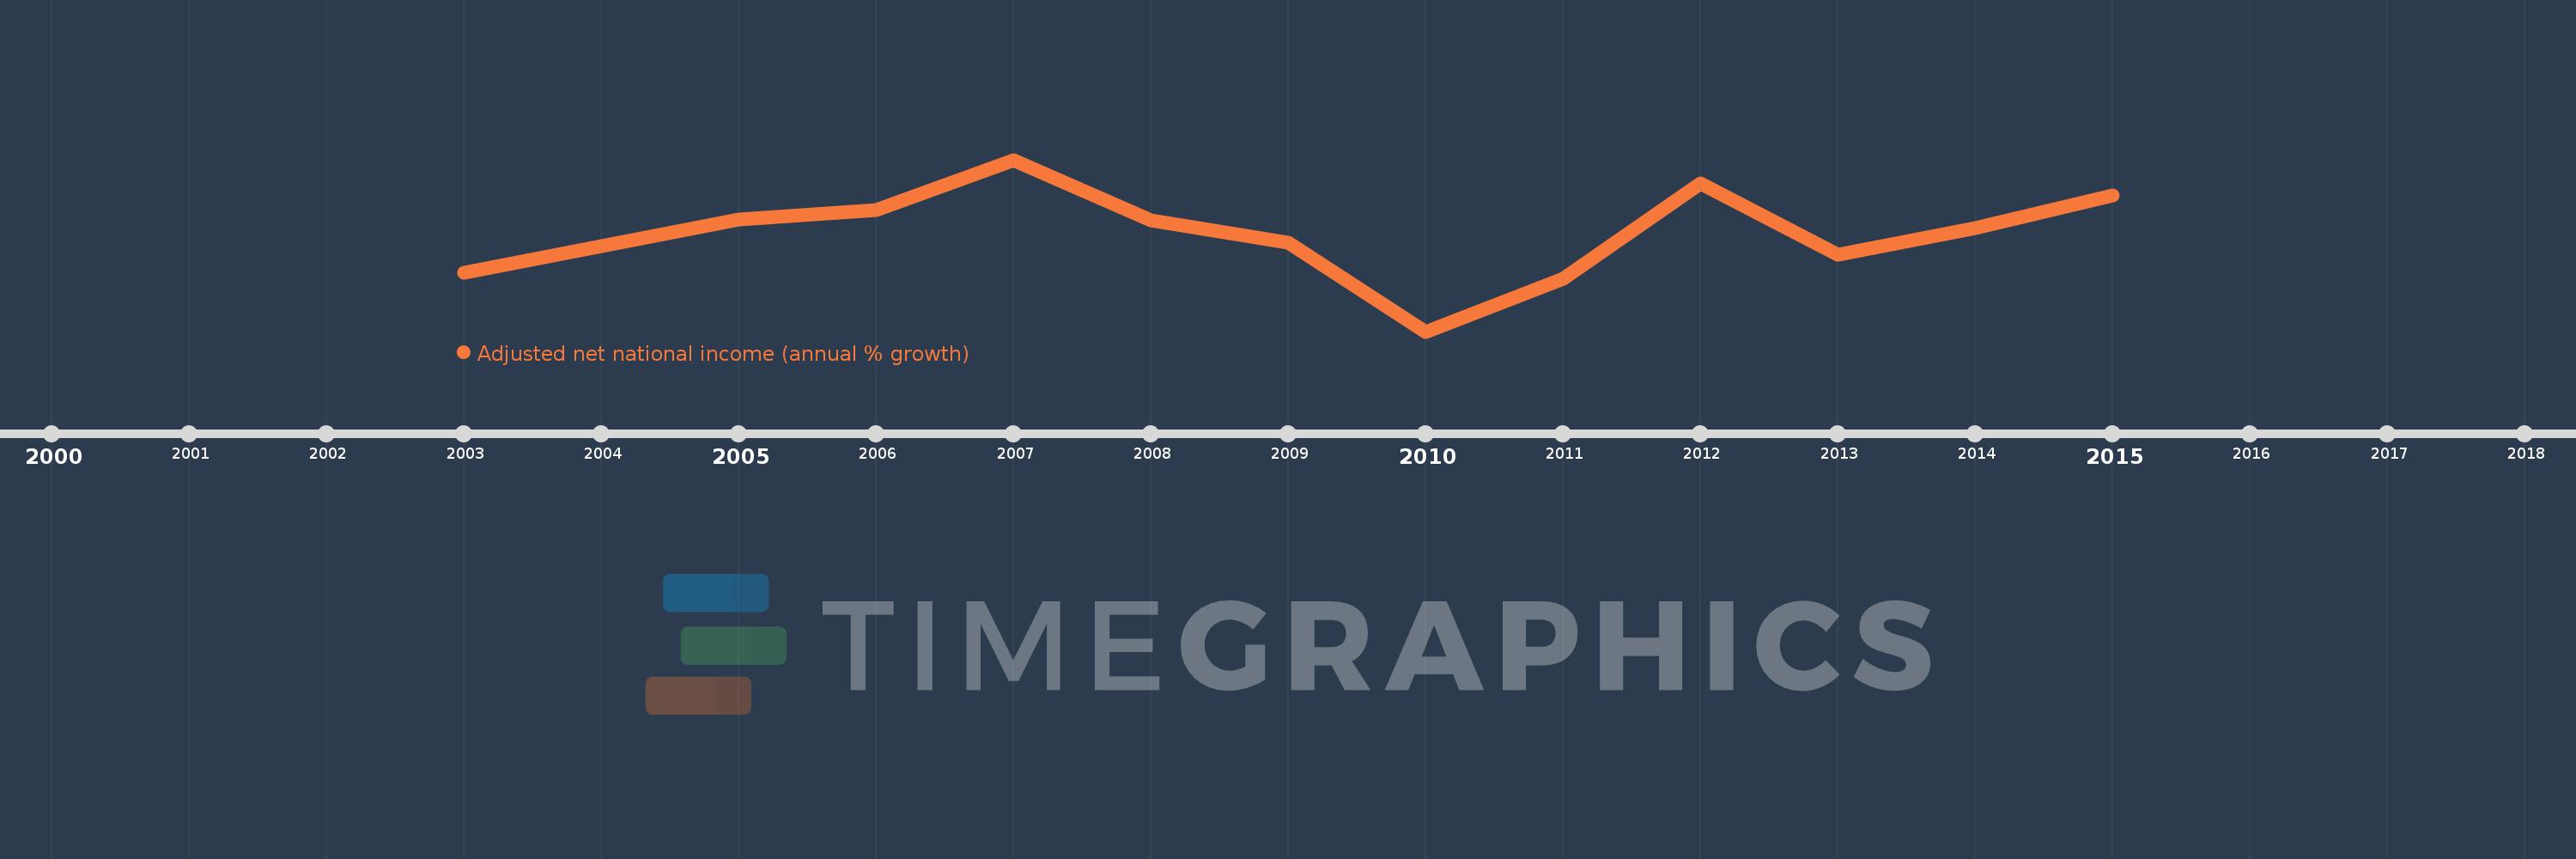
This timeline shows a graph from 2003 to 2015 of United Arab Emirates. No data until 2002. Number of actual observations by date: 13.
Source name:
World Development Indicators
Source organization:
World Bank staff estimates based on sources and methods in World Bank's "The Changing Wealth of Nations: Measuring Sustainable Development in the New Millennium" (2011).
Categories, topics:
Economy & Growth
Last updated:
apr 23, 2017
Indicators value changes by year
Meaning:
5.798
Minimum:
-9.914
jan 1, 2010
Maximum:
17.764
jan 1, 2007
At the date of observation
Value
Absolute change
Change from the previous value
jan 1, 2003
-0.389
-0.389
0.0%
jan 1, 2004
3.803
+4.193
-1.08K%
jan 1, 2005
8.194
+4.39
115.43%
jan 1, 2006
9.719
+1.525
18.61%
jan 1, 2007
17.764
+8.045
82.78%
jan 1, 2008
7.968
-9.797
-55.15%
jan 1, 2009
4.348
-3.619
-45.42%
jan 1, 2010
-9.914
-14.263
-328.0%
jan 1, 2011
-1.37
+8.544
-86.18%
jan 1, 2012
13.946
+15.316
-1.12K%
jan 1, 2013
2.474
-11.472
-82.26%
jan 1, 2014
6.813
+4.338
175.34%
jan 1, 2015
12.017
+5.204
76.39%
Ranking of countries by current statistics by years
