29
/
en
AIzaSyAYiBZKx7MnpbEhh9jyipgxe19OcubqV5w
April 1, 2024
223115
Philippines
PHL
true
2
1
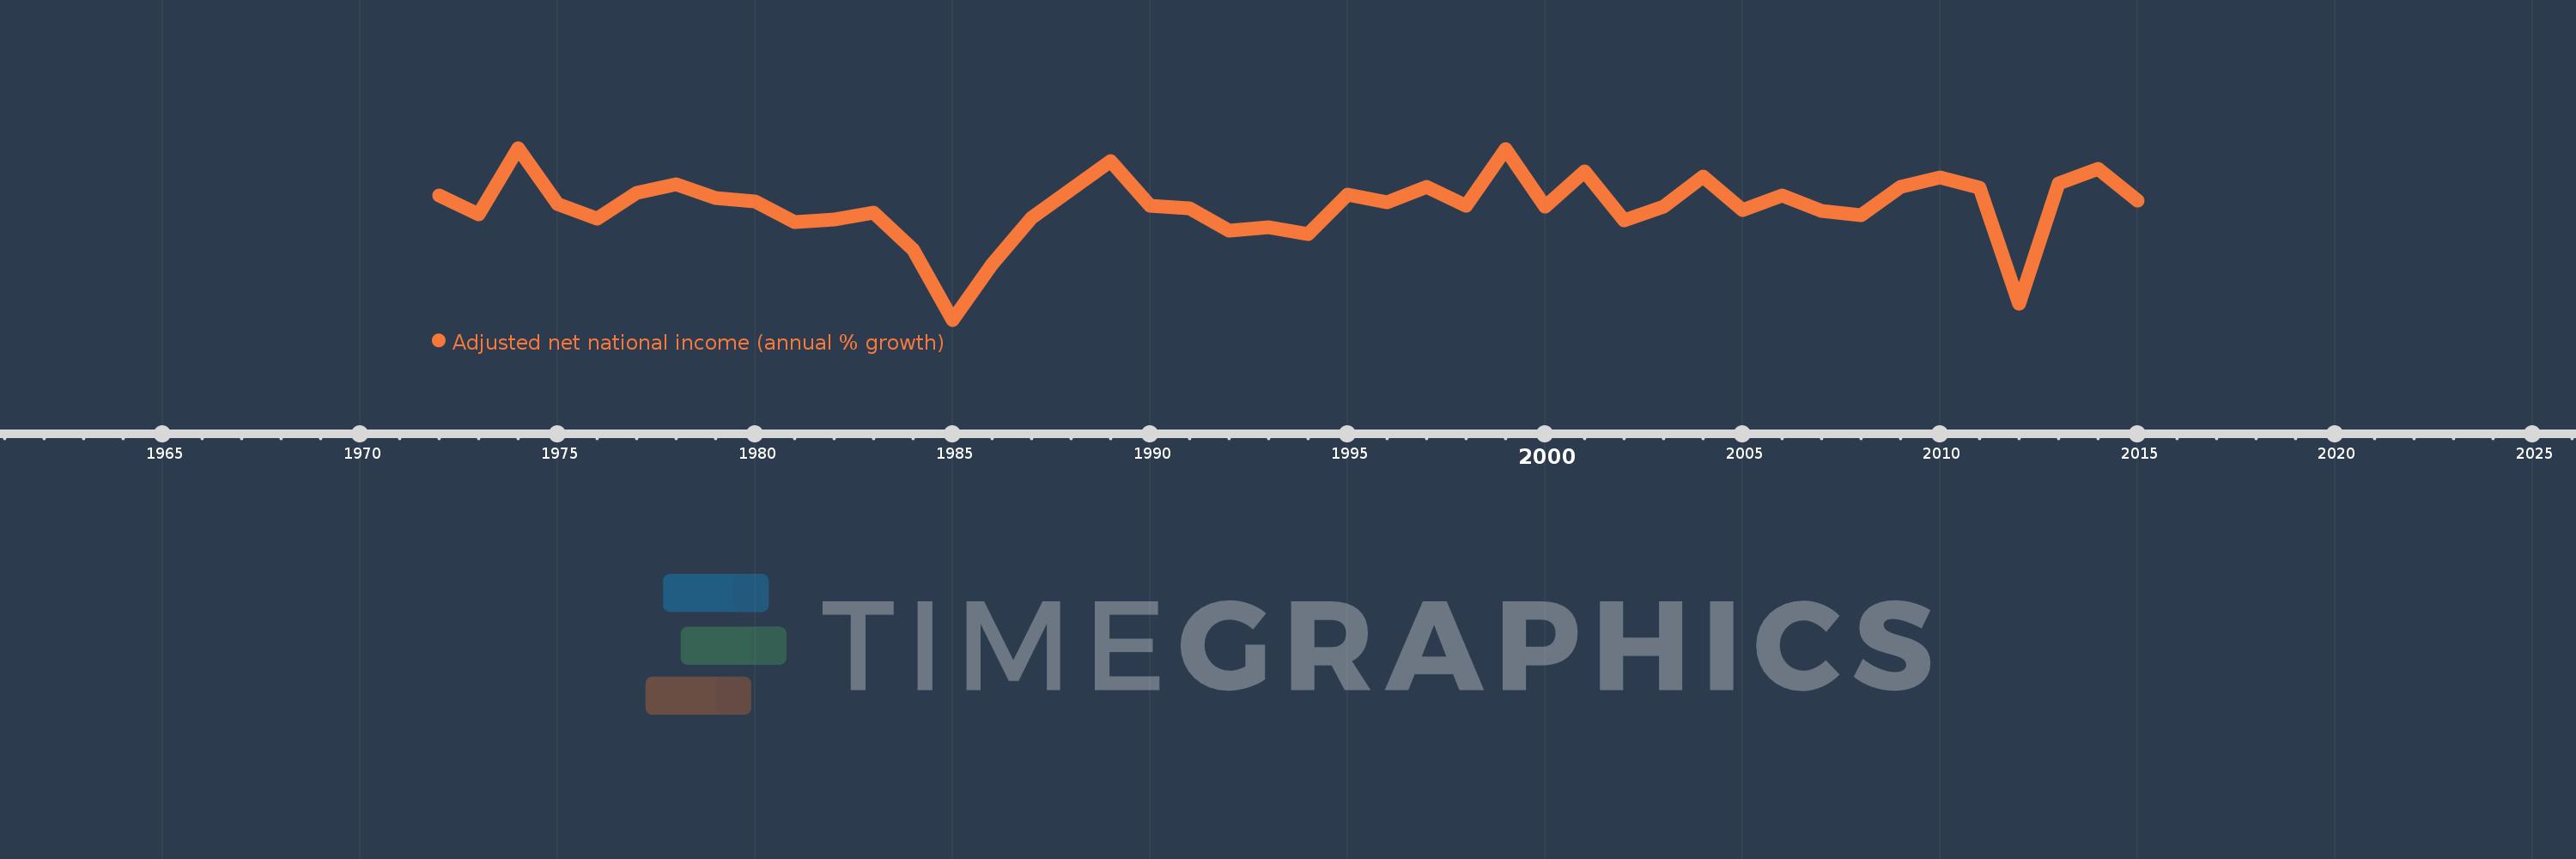
Adjusted net national income (annual % growth)
2015,2014,2013,2012,2011,2010,2009,2008,2007,2006,2005,2004,2003,2002,2001,2000,1999,1998,1997,1996,1995,1994,1993,1992,1991,1990,1989,1988,1987,1986,1985,1984,1983,1982,1981,1980,1979,1978,1977,1976,1975,1974,1973,1972
This statistics in other country:
Timeline:
This timeline shows a graph from 1972 to 2015 of Philippines. No data until 1971. Number of actual observations by date: 44.
Source name:
World Development Indicators
Source organization:
World Bank staff estimates based on sources and methods in World Bank's "The Changing Wealth of Nations: Measuring Sustainable Development in the New Millennium" (2011).
Categories, topics:
Economy & Growth
Last updated:
apr 23, 2017
Indicators value changes by year
Minimum:
-11.235
jan 1, 1985
Maximum:
12.645
jan 1, 1974
At the date of observation
Value
Absolute change
Change from previous value
jan 1, 1972
6.056
+6.056
0.0%
jan 1, 1973
3.429
-2.627
-43.37%
jan 1, 1974
12.645
+9.216
268.73%
jan 1, 1975
4.817
-7.828
-61.91%
jan 1, 1976
2.854
-1.963
-40.75%
jan 1, 1977
6.416
+3.562
124.82%
jan 1, 1978
7.557
+1.141
17.78%
jan 1, 1979
5.708
-1.849
-24.47%
jan 1, 1980
5.223
-0.485
-8.5%
jan 1, 1981
2.32
-2.903
-55.59%
jan 1, 1982
2.719
+0.399
17.22%
jan 1, 1983
3.613
+0.893
32.85%
jan 1, 1984
-1.47
-5.083
-140.69%
jan 1, 1985
-11.235
-9.765
664.28%
jan 1, 1986
-3.46
+7.774
-69.2%
jan 1, 1987
2.941
+6.401
-184.99%
jan 1, 1988
6.856
+3.915
133.11%
jan 1, 1989
10.825
+3.97
57.9%
jan 1, 1990
4.612
-6.213
-57.39%
jan 1, 1991
4.267
-0.345
-7.49%
jan 1, 1992
1.101
-3.166
-74.2%
jan 1, 1993
1.616
+0.515
46.75%
jan 1, 1994
0.695
-0.921
-56.99%
jan 1, 1995
6.199
+5.504
791.88%
jan 1, 1996
5.14
-1.059
-17.08%
jan 1, 1997
7.203
+2.063
40.14%
jan 1, 1998
4.571
-2.632
-36.54%
jan 1, 1999
12.52
+7.949
173.91%
jan 1, 2000
4.473
-8.047
-64.27%
jan 1, 2001
9.381
+4.908
109.74%
jan 1, 2002
2.588
-6.793
-72.42%
jan 1, 2003
4.506
+1.918
74.13%
jan 1, 2004
8.698
+4.193
93.06%
jan 1, 2005
4.011
-4.687
-53.89%
jan 1, 2006
6.072
+2.061
51.37%
jan 1, 2007
3.913
-2.159
-35.56%
jan 1, 2008
3.316
-0.597
-15.26%
jan 1, 2009
7.277
+3.962
119.49%
jan 1, 2010
8.49
+1.212
16.66%
jan 1, 2011
7.116
-1.374
-16.18%
jan 1, 2012
-9.025
-16.141
-226.82%
jan 1, 2013
7.734
+16.759
-185.7%
jan 1, 2014
9.787
+2.053
26.54%
jan 1, 2015
5.29
-4.497
-45.95%
Ranking of countries by current statistics by years


Comments: