29
/
en
AIzaSyAYiBZKx7MnpbEhh9jyipgxe19OcubqV5w
April 1, 2024
280548
Venezuela, RB
VEN
true
2
1
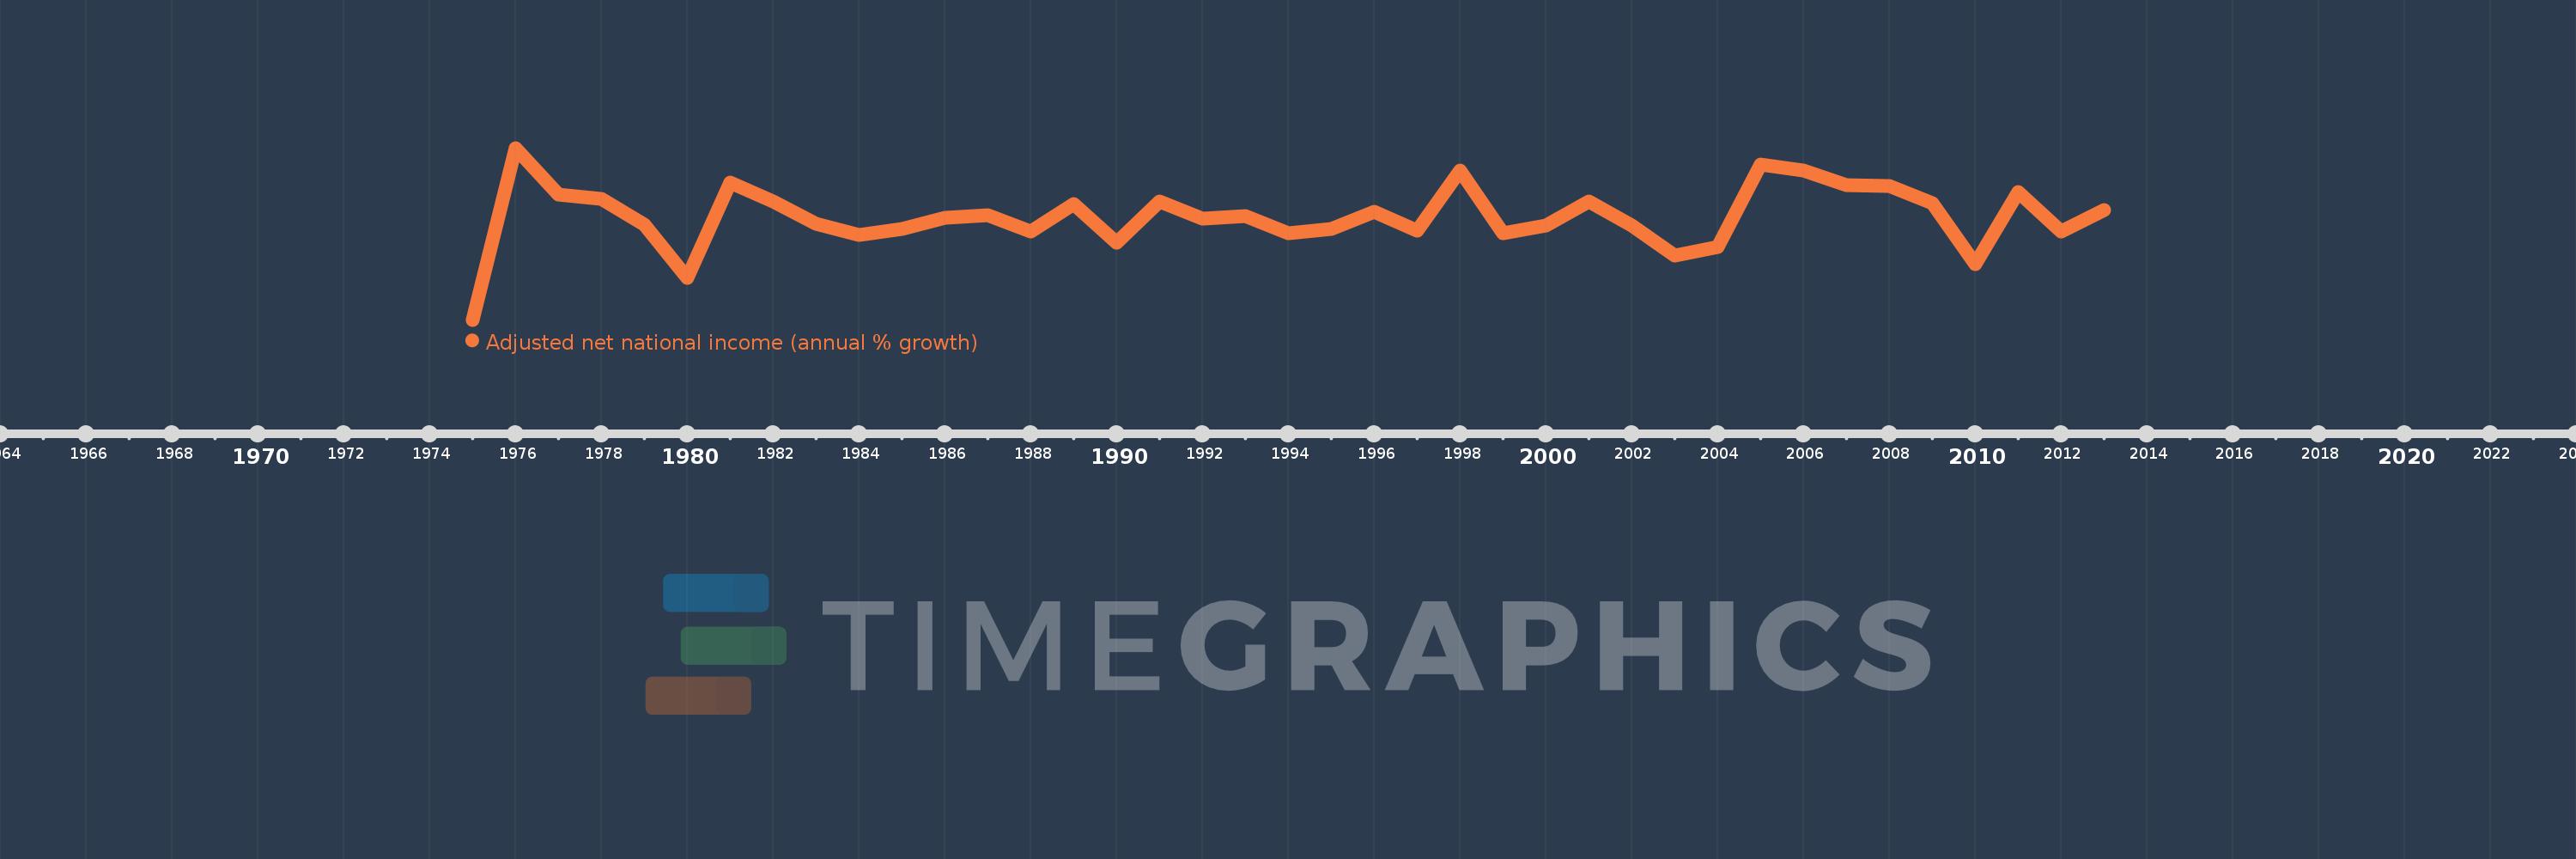
Adjusted net national income (annual % growth)
2013,2012,2011,2010,2009,2008,2007,2006,2005,2004,2003,2002,2001,2000,1999,1998,1997,1996,1995,1994,1993,1992,1991,1990,1989,1988,1987,1986,1985,1984,1983,1982,1981,1980,1979,1978,1977,1976,1975
This statistics in other country:
Timeline:
This timeline shows a graph from 1975 to 2013 of Venezuela, RB. No data until 1974. Number of actual observations by date: 39.
Source name:
World Development Indicators
Source organization:
World Bank staff estimates based on sources and methods in World Bank's "The Changing Wealth of Nations: Measuring Sustainable Development in the New Millennium" (2011).
Categories, topics:
Economy & Growth
Last updated:
apr 23, 2017
Indicators value changes by year
Minimum:
-34.611
jan 1, 1975
Maximum:
29.928
jan 1, 1976
At the date of observation
Value
Absolute change
Change from previous value
jan 1, 1975
-34.611
-34.611
0.0%
jan 1, 1976
29.928
+64.538
-186.47%
jan 1, 1977
12.356
-17.572
-58.72%
jan 1, 1978
10.808
-1.547
-12.52%
jan 1, 1979
1.104
-9.704
-89.79%
jan 1, 1980
-18.972
-20.076
-1.82K%
jan 1, 1981
16.963
+35.935
-189.41%
jan 1, 1982
9.701
-7.261
-42.81%
jan 1, 1983
1.379
-8.322
-85.79%
jan 1, 1984
-2.88
-4.259
-308.85%
jan 1, 1985
-0.433
+2.447
-84.96%
jan 1, 1986
3.716
+4.149
-957.92%
jan 1, 1987
4.567
+0.85
22.88%
jan 1, 1988
-1.372
-5.938
-130.04%
jan 1, 1989
8.974
+10.346
-754.26%
jan 1, 1990
-5.726
-14.701
-163.81%
jan 1, 1991
9.87
+15.596
-272.37%
jan 1, 1992
3.4
-6.47
-65.55%
jan 1, 1993
4.295
+0.894
26.3%
jan 1, 1994
-2.088
-6.383
-148.62%
jan 1, 1995
-0.469
+1.619
-77.55%
jan 1, 1996
5.94
+6.409
-1.37K%
jan 1, 1997
-1.136
-7.076
-119.12%
jan 1, 1998
21.386
+22.522
-1.98K%
jan 1, 1999
-2.016
-23.402
-109.43%
jan 1, 2000
0.725
+2.741
-135.95%
jan 1, 2001
9.929
+9.204
1.27K%
jan 1, 2002
0.938
-8.991
-90.55%
jan 1, 2003
-10.646
-11.585
-1.23K%
jan 1, 2004
-7.267
+3.379
-31.74%
jan 1, 2005
23.81
+31.077
-427.62%
jan 1, 2006
21.313
-2.496
-10.48%
jan 1, 2007
15.815
-5.499
-25.8%
jan 1, 2008
15.663
-0.152
-0.96%
jan 1, 2009
9.059
-6.604
-42.16%
jan 1, 2010
-13.838
-22.897
-252.74%
jan 1, 2011
13.273
+27.111
-195.92%
jan 1, 2012
-1.529
-14.803
-111.52%
jan 1, 2013
6.473
+8.003
-523.24%
Ranking of countries by current statistics by years


Comments: