29
/
en
AIzaSyAYiBZKx7MnpbEhh9jyipgxe19OcubqV5w
April 1, 2024
143928
Guatemala
GTM
true
2
1
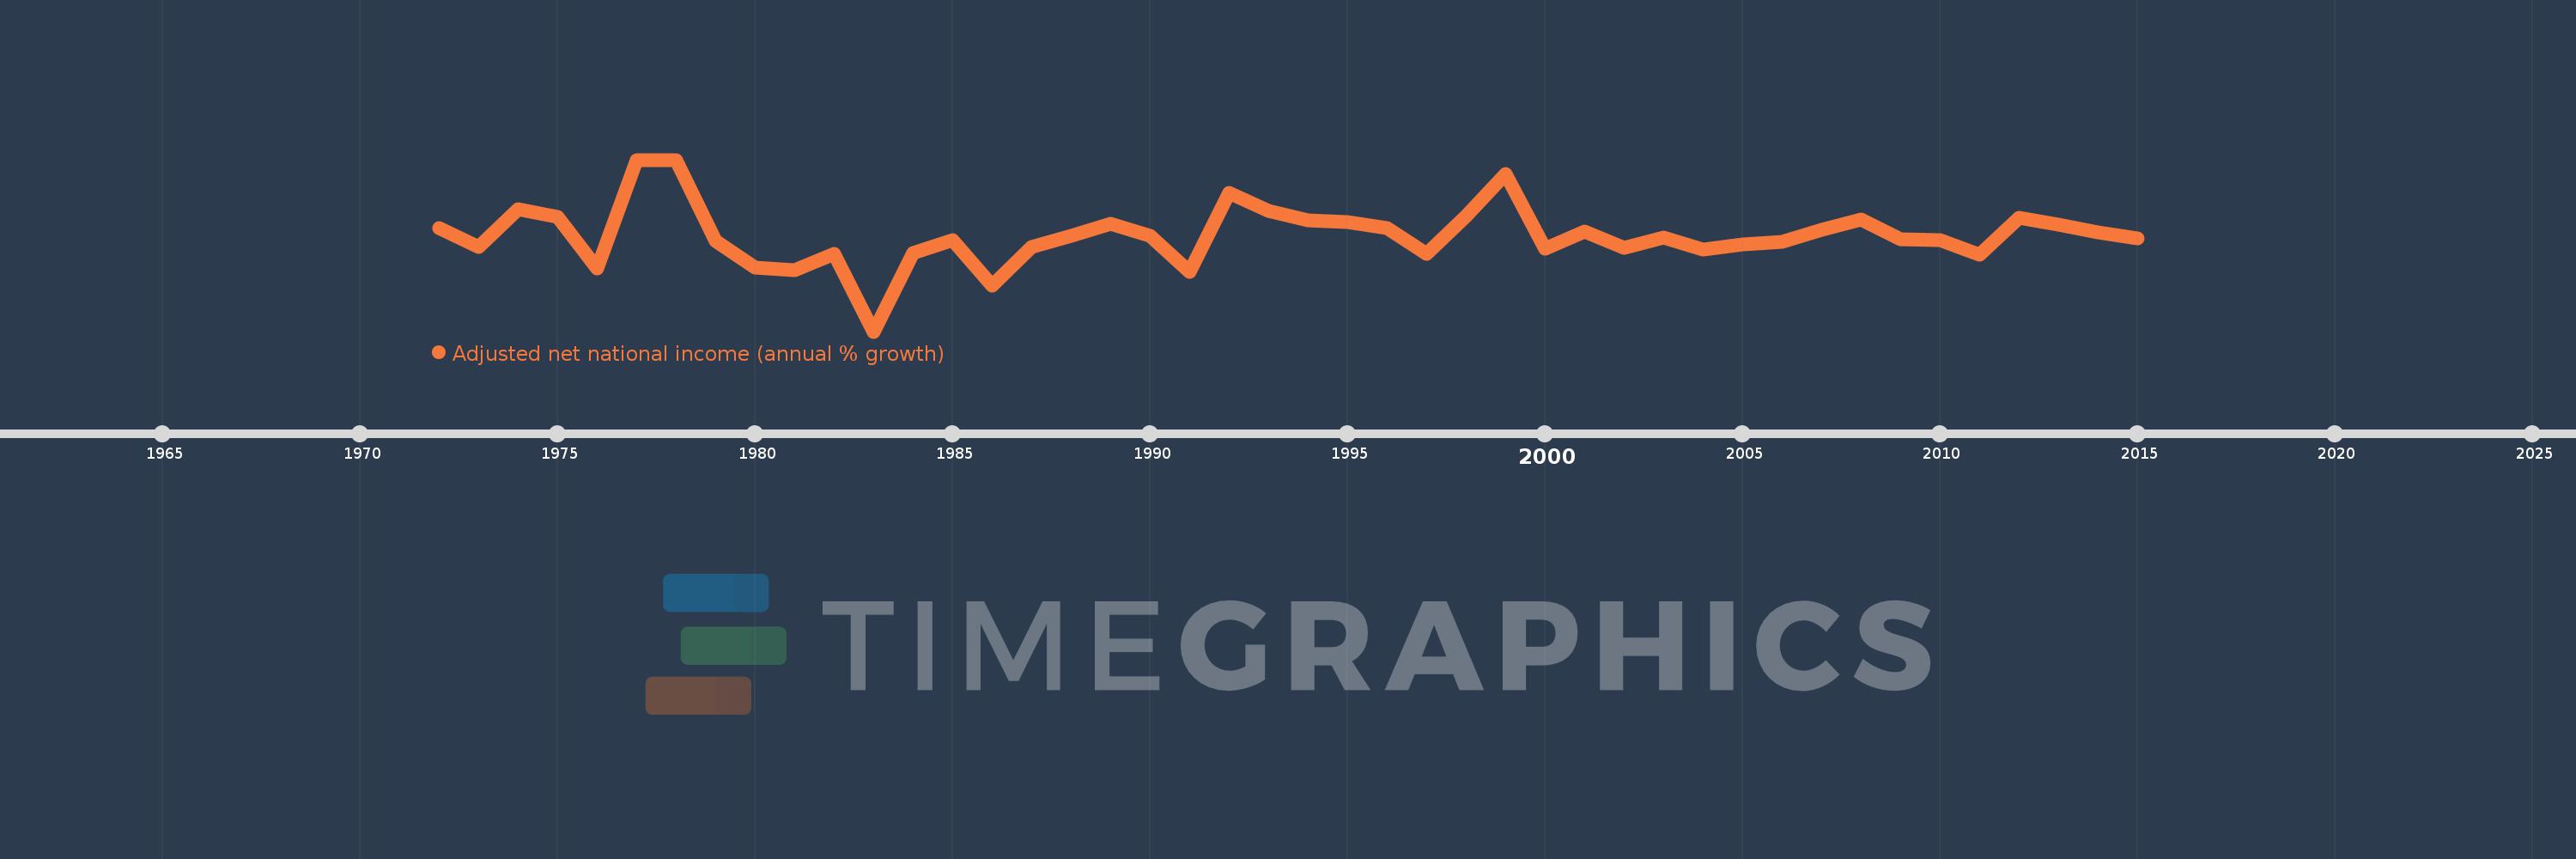
Adjusted net national income (annual % growth)
2015,2014,2013,2012,2011,2010,2009,2008,2007,2006,2005,2004,2003,2002,2001,2000,1999,1998,1997,1996,1995,1994,1993,1992,1991,1990,1989,1988,1987,1986,1985,1984,1983,1982,1981,1980,1979,1978,1977,1976,1975,1974,1973,1972
This statistics in other country:
Timeline:
This timeline shows a graph from 1972 to 2015 of Guatemala. No data until 1971. Number of actual observations by date: 44.
Source name:
World Development Indicators
Source organization:
World Bank staff estimates based on sources and methods in World Bank's "The Changing Wealth of Nations: Measuring Sustainable Development in the New Millennium" (2011).
Categories, topics:
Economy & Growth
Last updated:
apr 23, 2017
Indicators value changes by year
Minimum:
-8.963
jan 1, 1983
At the date of observation
Value
Absolute change
Change from previous value
jan 1, 1972
4.259
+4.259
0.0%
jan 1, 1973
1.881
-2.379
-55.85%
jan 1, 1974
6.753
+4.873
259.1%
jan 1, 1975
5.708
-1.045
-15.47%
jan 1, 1976
-0.838
-6.546
-114.67%
jan 1, 1977
13.012
+13.849
-1.65K%
jan 1, 1978
13.06
+0.048
0.37%
jan 1, 1979
2.649
-10.411
-79.72%
jan 1, 1980
-0.751
-3.399
-128.34%
jan 1, 1981
-1.116
-0.366
48.72%
jan 1, 1982
0.976
+2.092
-187.42%
jan 1, 1983
-8.963
-9.939
-1.02K%
jan 1, 1984
1.088
+10.051
-112.14%
jan 1, 1985
2.716
+1.628
149.64%
jan 1, 1986
-3.059
-5.775
-212.64%
jan 1, 1987
1.937
+4.996
-163.33%
jan 1, 1988
3.331
+1.393
71.92%
jan 1, 1989
4.851
+1.52
45.63%
jan 1, 1990
3.269
-1.582
-32.6%
jan 1, 1991
-1.32
-4.589
-140.38%
jan 1, 1992
8.804
+10.125
-766.91%
jan 1, 1993
6.47
-2.334
-26.51%
jan 1, 1994
5.286
-1.185
-18.31%
jan 1, 1995
5.098
-0.188
-3.55%
jan 1, 1996
4.262
-0.835
-16.39%
jan 1, 1997
1.008
-3.254
-76.35%
jan 1, 1998
5.855
+4.847
480.92%
jan 1, 1999
11.29
+5.434
92.81%
jan 1, 2000
1.69
-9.599
-85.03%
jan 1, 2001
3.847
+2.157
127.63%
jan 1, 2002
1.761
-2.087
-54.23%
jan 1, 2003
3.098
+1.338
75.97%
jan 1, 2004
1.53
-1.568
-50.61%
jan 1, 2005
2.178
+0.648
42.33%
jan 1, 2006
2.549
+0.371
17.02%
jan 1, 2007
4.078
+1.53
60.02%
jan 1, 2008
5.425
+1.347
33.03%
jan 1, 2009
2.845
-2.581
-47.57%
jan 1, 2010
2.79
-0.055
-1.93%
jan 1, 2011
0.914
-1.875
-67.22%
jan 1, 2012
5.609
+4.694
513.33%
jan 1, 2013
4.715
-0.894
-15.94%
jan 1, 2014
3.719
-0.995
-21.11%
jan 1, 2015
3.034
-0.685
-18.42%
Ranking of countries by current statistics by years


Comments: