29
/
en
AIzaSyAYiBZKx7MnpbEhh9jyipgxe19OcubqV5w
April 1, 2024
80130
Belarus
BLR
true
2
1
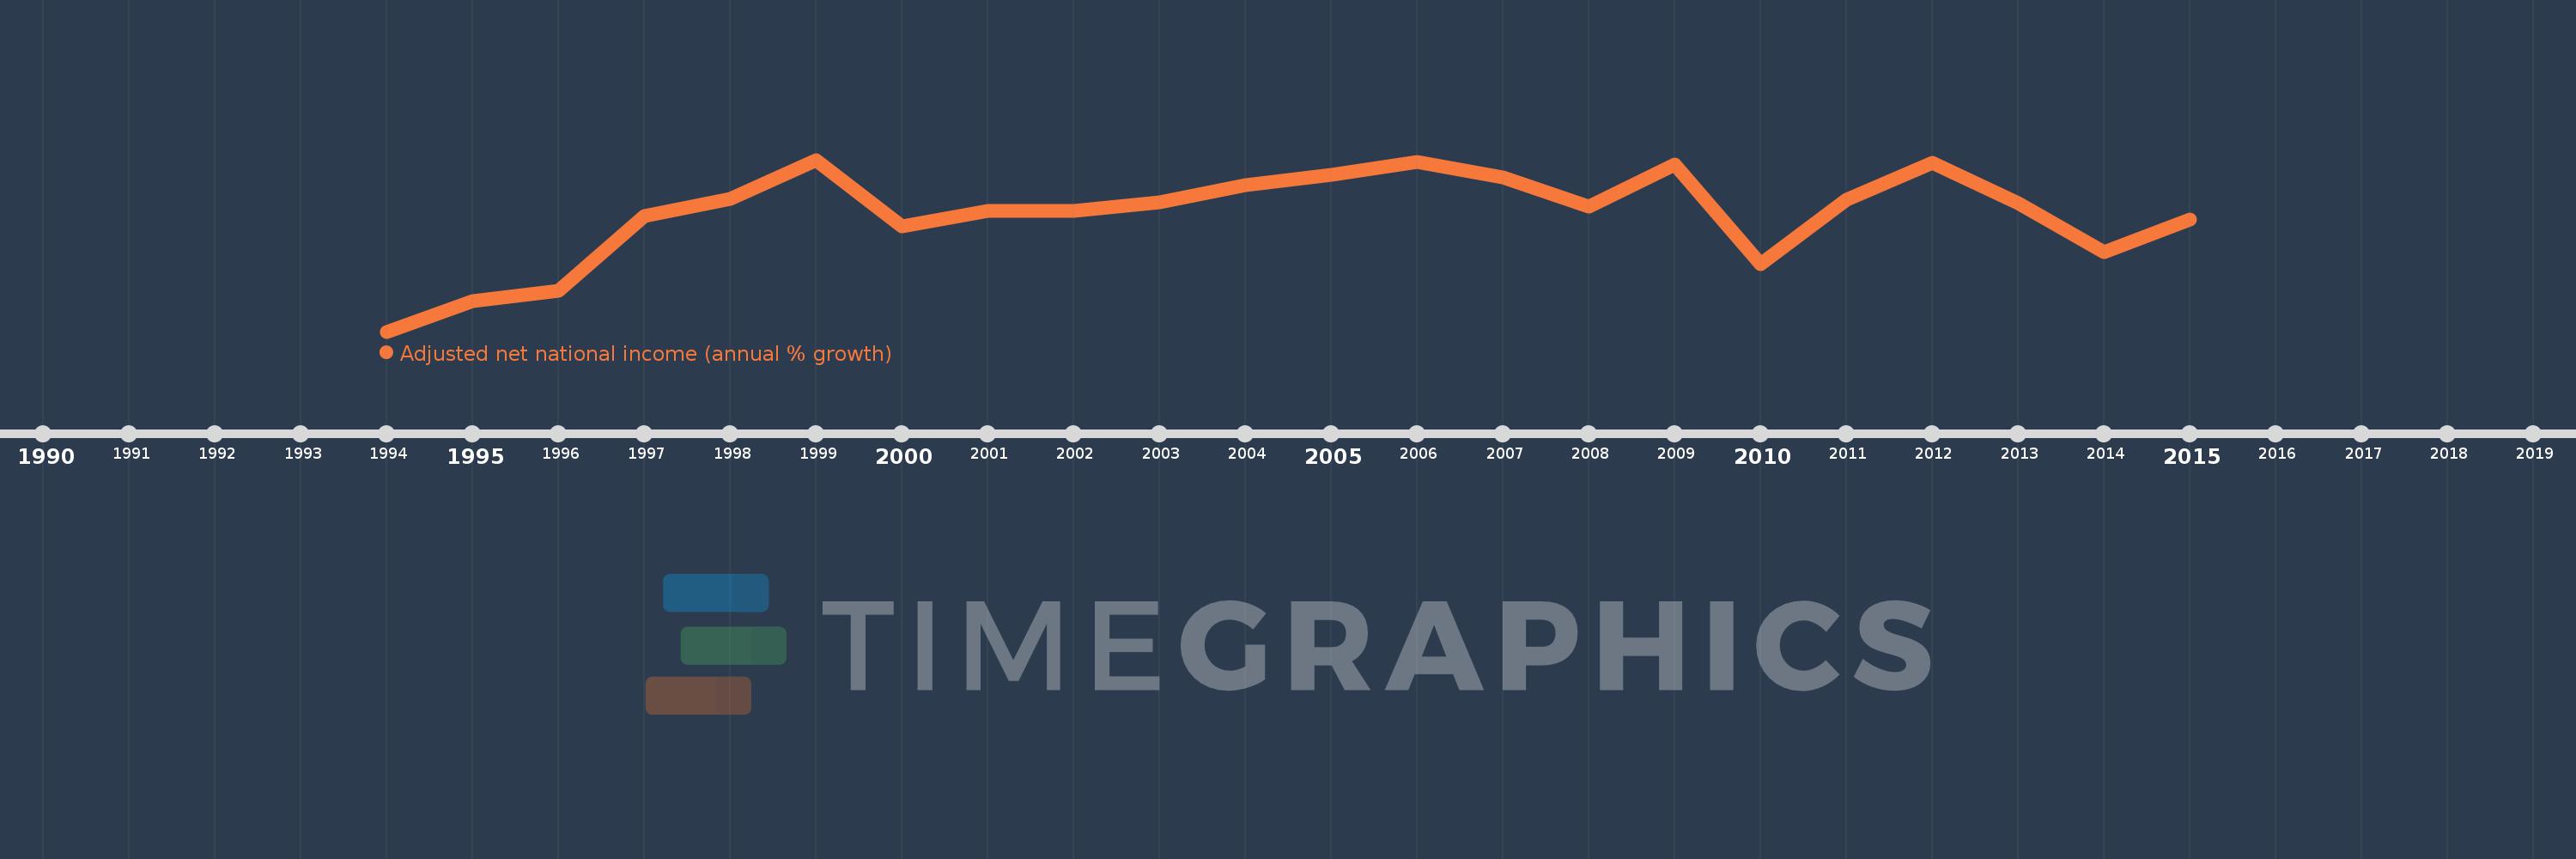
Adjusted net national income (annual % growth)
2015,2014,2013,2012,2011,2010,2009,2008,2007,2006,2005,2004,2003,2002,2001,2000,1999,1998,1997,1996,1995,1994
This statistics in other country:
Timeline:
This timeline shows a graph from 1994 to 2015 of Belarus. No data until 1993. Number of actual observations by date: 22.
Source name:
World Development Indicators
Source organization:
World Bank staff estimates based on sources and methods in World Bank's "The Changing Wealth of Nations: Measuring Sustainable Development in the New Millennium" (2011).
Categories, topics:
Economy & Growth
Last updated:
apr 23, 2017
Indicators value changes by year
Minimum:
-23.775
jan 1, 1994
Maximum:
17.868
jan 1, 1999
At the date of observation
Value
Absolute change
Change from previous value
jan 1, 1994
-23.775
-23.775
0.0%
jan 1, 1995
-16.465
+7.31
-30.75%
jan 1, 1996
-13.98
+2.485
-15.1%
jan 1, 1997
4.299
+18.279
-130.76%
jan 1, 1998
8.363
+4.063
94.5%
jan 1, 1999
17.868
+9.506
113.67%
jan 1, 2000
1.756
-16.113
-90.17%
jan 1, 2001
5.418
+3.663
208.63%
jan 1, 2002
5.51
+0.091
1.69%
jan 1, 2003
7.526
+2.016
36.59%
jan 1, 2004
11.787
+4.261
56.63%
jan 1, 2005
14.204
+2.417
20.51%
jan 1, 2006
17.391
+3.186
22.43%
jan 1, 2007
13.542
-3.849
-22.13%
jan 1, 2008
6.591
-6.951
-51.33%
jan 1, 2009
16.824
+10.233
155.25%
jan 1, 2010
-7.432
-24.256
-144.18%
jan 1, 2011
8.163
+15.595
-209.83%
jan 1, 2012
17.148
+8.985
110.07%
jan 1, 2013
7.374
-9.774
-57.0%
jan 1, 2014
-4.438
-11.812
-160.18%
jan 1, 2015
3.329
+7.767
-175.0%
Ranking of countries by current statistics by years


Comments: