29
/
en
AIzaSyAYiBZKx7MnpbEhh9jyipgxe19OcubqV5w
April 1, 2024
38696
IDA only
IDX
false
2
1
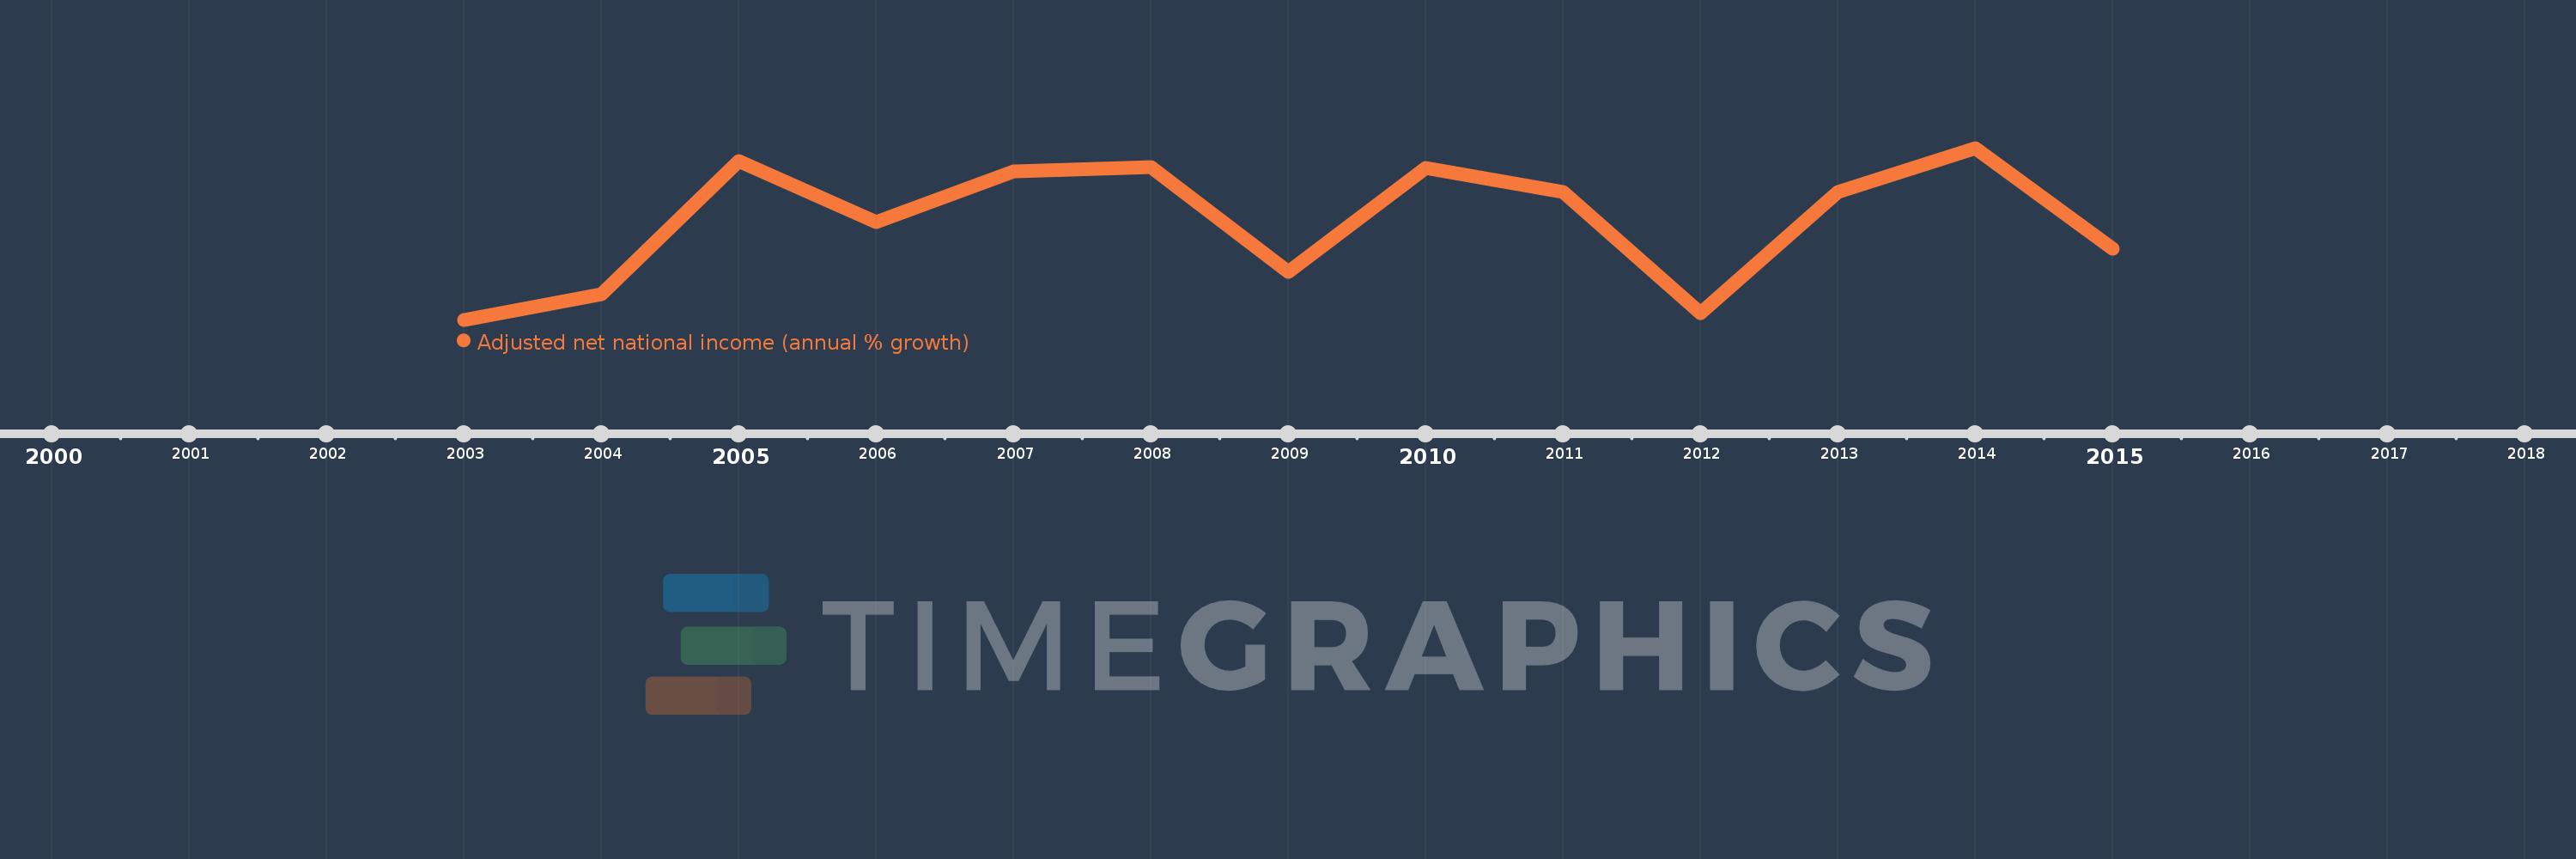
Adjusted net national income (annual % growth)
2015,2014,2013,2012,2011,2010,2009,2008,2007,2006,2005,2004,2003
This statistics in other country:
Timeline:
This timeline shows a graph from 2003 to 2015 of IDA only. No data until 2002. Number of actual observations by date: 13.
Source name:
World Development Indicators
Source organization:
World Bank staff estimates based on sources and methods in World Bank's "The Changing Wealth of Nations: Measuring Sustainable Development in the New Millennium" (2011).
Categories, topics:
Economy & Growth
Last updated:
apr 23, 2017
Indicators value changes by year
At the date of observation
Value
Absolute change
Change from previous value
jan 1, 2003
3.461
+3.461
0.0%
jan 1, 2004
3.927
+0.465
13.45%
jan 1, 2005
6.331
+2.404
61.22%
jan 1, 2006
5.226
-1.105
-17.45%
jan 1, 2007
6.138
+0.912
17.46%
jan 1, 2008
6.224
+0.085
1.39%
jan 1, 2009
4.323
-1.9
-30.53%
jan 1, 2010
6.211
+1.887
43.66%
jan 1, 2011
5.768
-0.443
-7.13%
jan 1, 2012
3.588
-2.18
-37.8%
jan 1, 2013
5.776
+2.189
61.01%
jan 1, 2014
6.567
+0.79
13.68%
jan 1, 2015
4.74
-1.827
-27.82%
Ranking of countries by current statistics by years


Comments: